
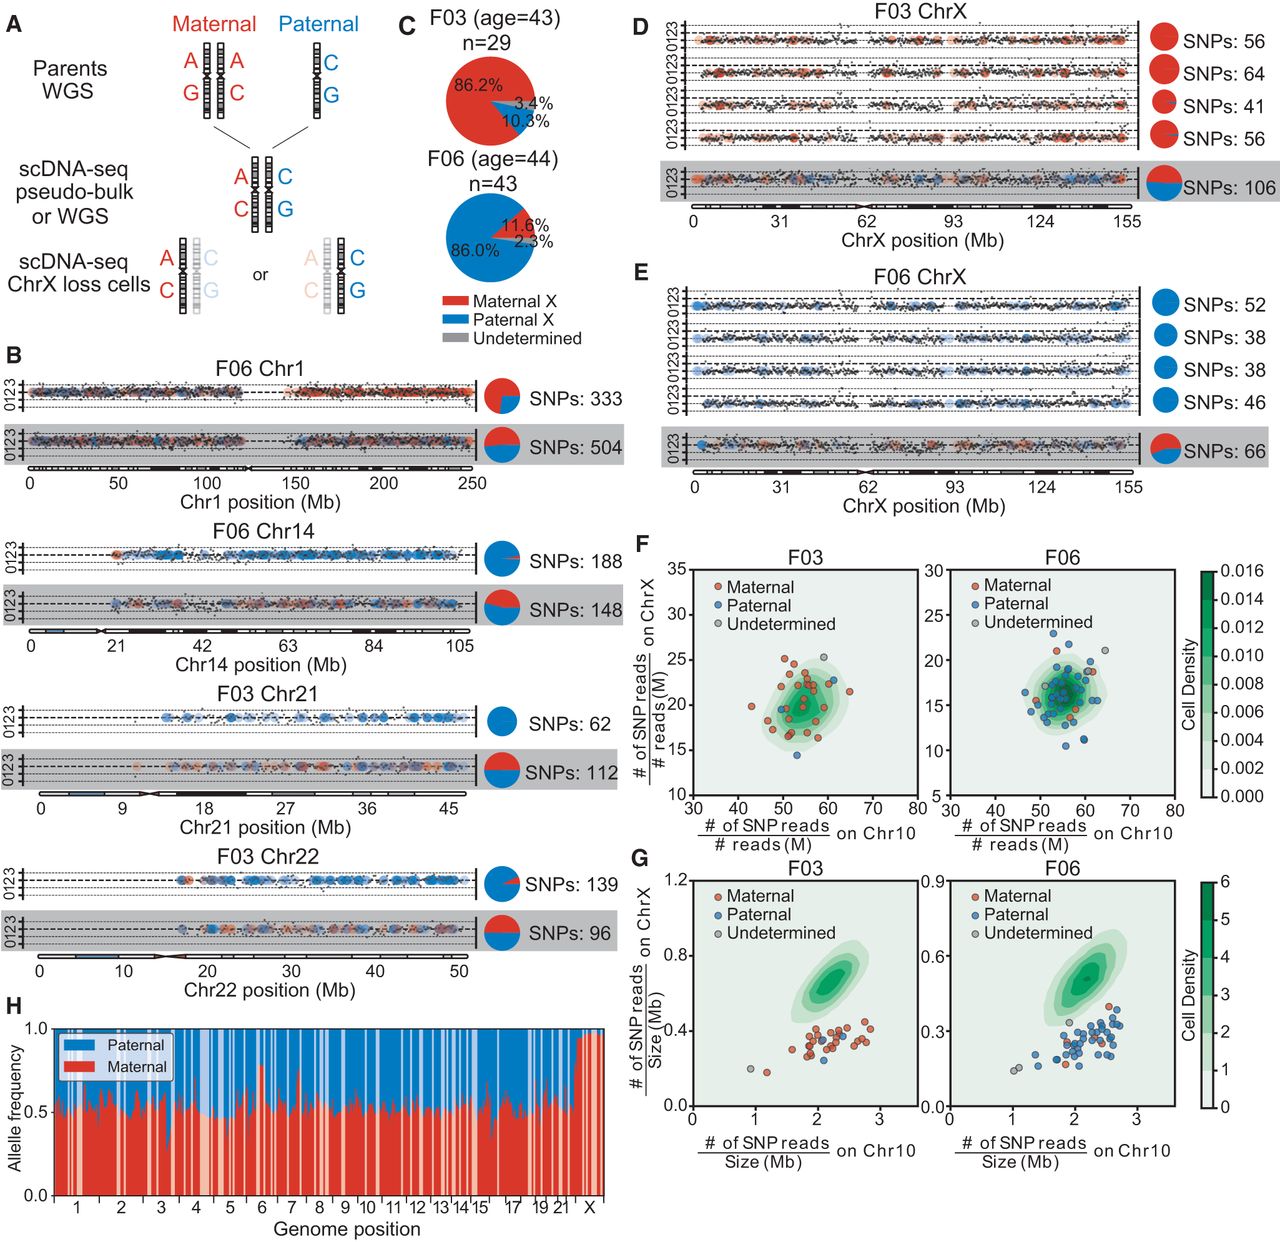
Single-cell (female) haplotype analysis. (A) Haplotype identification pipeline of representative chromosome-loss cells. For each candidate, two parental genomes were sequenced by whole-genome sequencing (WGS). Then, using WGS data or merged single-cell data (pseudobulk), we identified each candidate's heterogeneous sites. Combined with parental data, the heterogeneous sites were labeled paternal or maternal. Finally, we analyzed each candidate's single cells that had chromosome loss and extracted heterogeneous sites covered by reads, identifying each as paternal or maternal. (B) Copy number profiles and haplotype identifications of cells with lost heterozygosity. Black dots show the copy number for each genome locus and dashed lines indicate the integer copy number (0,1,2,3). Colored dots represent the sources of a heterozygous site (red, maternal; blue, paternal) and the pie charts demonstrate the paternal/maternal compositions (numbers of single-nucleotide polymorphisms [SNPs]) of heterozygous sites on each chromosome. Results from normal cells are shown on the bottom for comparison. (C) Paternal and maternal allele composition of two individuals’ cells with lost X Chromosomes. Most of the X-loss cells were of the same parental allele. (D,E) Copy number profiles and haplotype identifications of cells with lost X Chromosomes and of normal cells, as controls (bottom lines). (F) SNP densities and (G) reads densities on chromosomes of normal and Chr X-loss cells. The contour plots show the normal cells’ distributions and the scatterplots show the Chr X-loss cells. Cells with lost X Chromosomes that have lower reads density on Chr X, but comparable SNPs density, were not contaminated by male or parental cells. (H) Allele compositions of heterogeneous sites in bulk RNA-seq reads of F03 cells. Most of the genomic region displays biallelic expression (allele composition ∼50%), but Chr X clearly shows a maternal bias, which is corrected when most Chr X-loss cells are paternal.


