
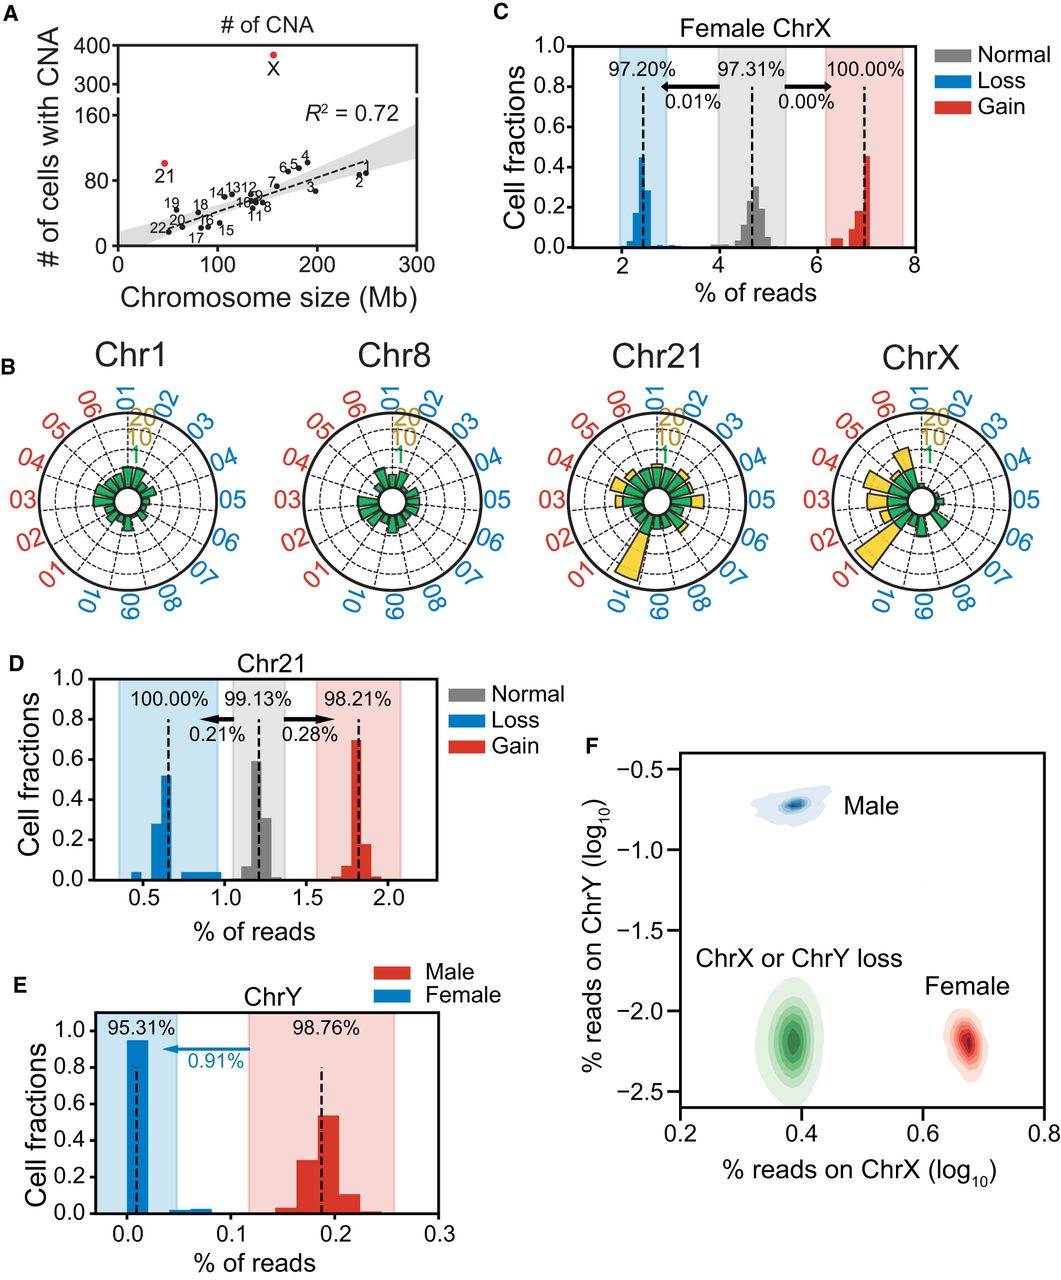
Clonal analysis of cells with CNAs. (A) Numbers of cells with CNAs for each chromosome. The dashed line indicates a significant correlation between chromosome size and numbers of CNAs. Chromosomes 21 and X (red) had markedly higher numbers of CNAs than the rest of the chromosomes. (B) Radar plots show normalized CNA counts in four chromosomes from every individual labeled around each plot (blue, male; red, female). Internal colors denote a graded scale of CNA counts (green, 0–1; yellow, 1–20). (C–E) Reads counts distributions on Chromosomes X (C), 21 (D), and Y (E). Each histogram shows the normalized reads distributions for each type of cells (gain, loss, and normal). Dashed lines indicate the means of each type of cell. The color shade indicates the confidence interval within three standard deviations. The percentage in each shaded bar indicates the fraction of cells identified as normal/loss/gain using reads counts. The percentages under the arrows show the fractions of normal cells found, using reads counts, in the loss/gain confidence intervals. For Chromosome Y, those male cells that fell into the female confidence interval were identified as Chromosome Y losses. (F) Reads densities of Chr X and Chr Y of normal male cells (blue), normal female cells (red), and abnormal male and female cells with Chr Y or Chr X loss, respectively (both green).


