
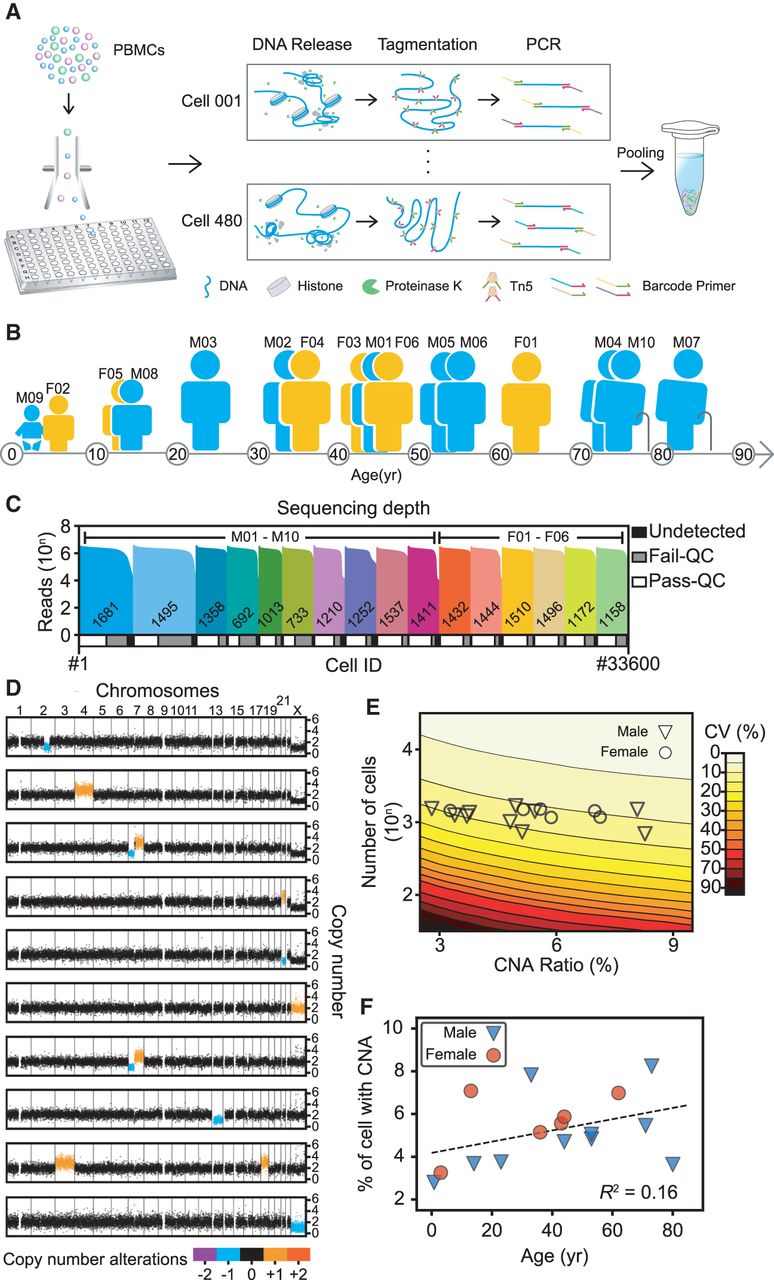
Overview of the study design. (A) Experimental flow used in this study. Lymphocytes were sorted to 96-well plates using fluorescence-activated cell sorting to obtain one cell per well. Thousands of those single cells were lysed, tagmented, barcoded, and amplified in their wells and then pooled for second-generation sequencing. PBMC, peripheral blood mononuclear cells. (B) Cartoon showing the blood donors’ ages, sex, and ID numbers: six females (F) and 10 males (M) between 9 mo and 80 yr of age. (C) Sequencing depths and cell numbers for all samples in this study. The top histogram shows the reads counts distribution and the diagram underneath represents the relative proportions of cells after filtering. Undetected, low read counts; Fail-QC, failed quality filtering; Pass-QC, passed quality filtering. (D) Copy number profiles of representative cells with copy number alterations (CNAs) in colors. (E) Coefficients of variation (CVs) of CNA ratio estimations. The contour plot shows both the theoretical CVs of CNA ratios (calculated by simulation) and the sample sizes (number of cells). The symbols show the real CNA ratios and sample sizes for each sample in this study. The large sample size in our study ensured that the CV was in a relatively small interval, thus providing acceptably accurate estimations. (F) Ages and autosomal CNA percentages of each sample. The dashed line indicates a weak linear relationship between age and CNA ratios.


