
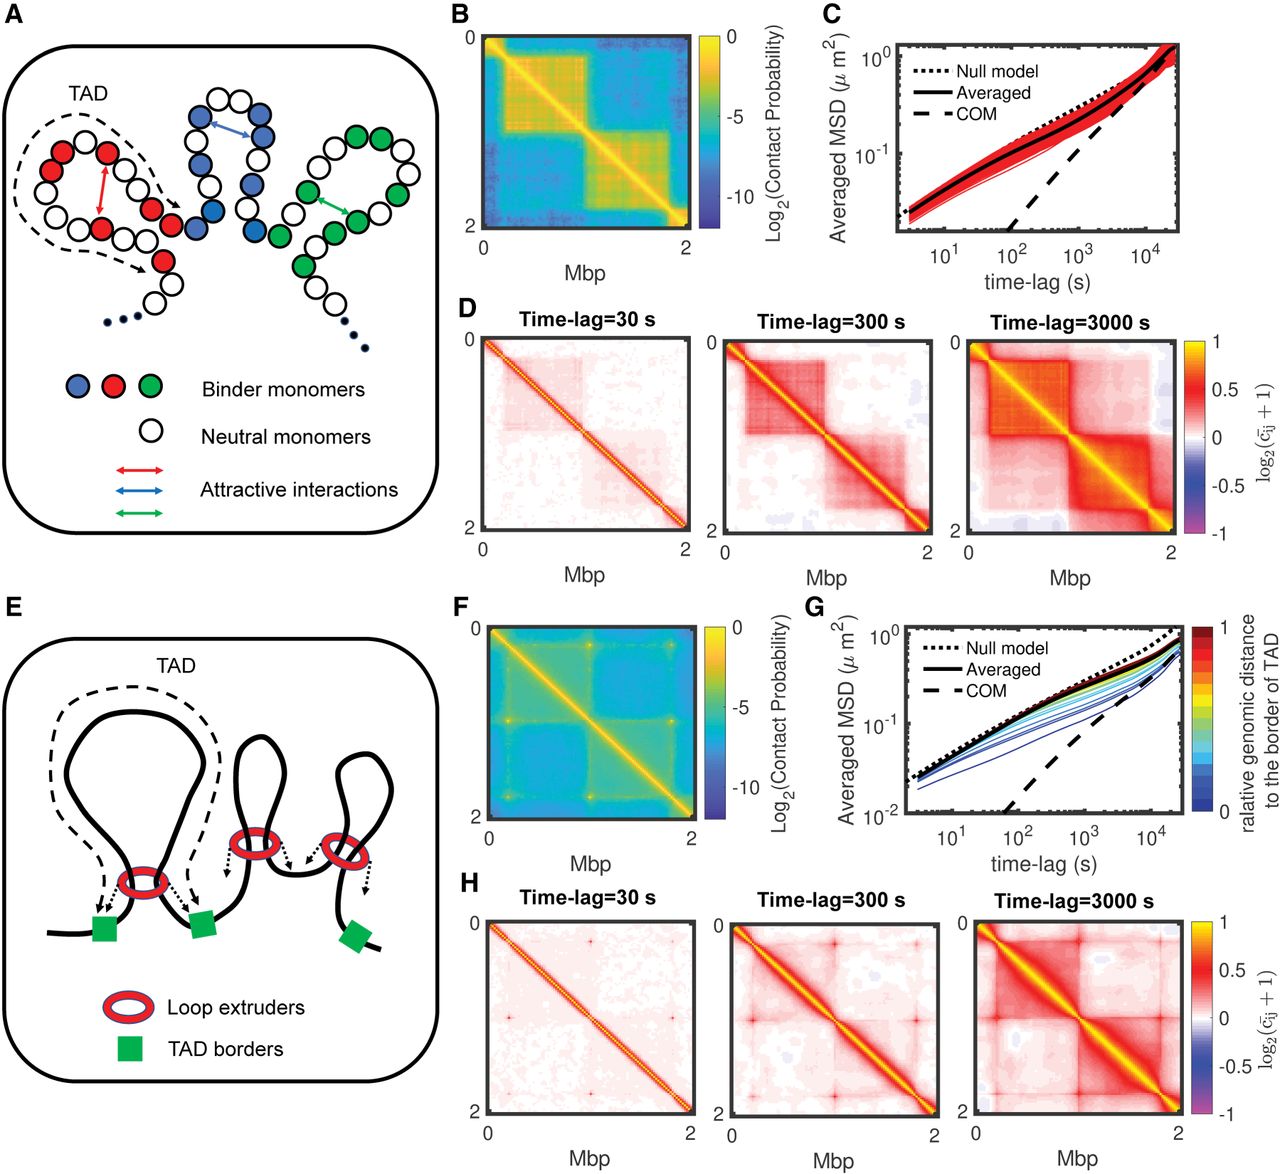
Effects of alternative mechanisms for TAD formation on anomalous behaviors. (A) Schematic representation of a binder model for TAD formation. (B) A 2-Mb zoom of the predicted Hi-C map for a toy model with 800-kbp-long TADs, a density of binder monomers of 0.5 and an
attractive interaction of −0.2 kT (for other examples, see Supplemental Fig. S13). (C) Ensemble-averaged MSDs of the binder monomers with their average and the MSD of the TAD center of mass for the same parameters
as in B. (D) For the example shown in B, 2-Mb zooms in the matrix of pair correlations  for different time lags. (E) Schematic representation of the loop extrusion model. (F) A 2-Mb zoom of the predicted Hi-C map for a toy model with 800-kbp-long TADs and about 80 bound extruding factors (for other
examples, see Supplemental Fig. S14). (G) Ensemble-averaged MSDs colored by the relative position of the monomer to the nearest TAD border for the same parameters
as in F. (H) For the example shown in F, 2-Mb zooms in the matrix of pair correlations
for different time lags. (E) Schematic representation of the loop extrusion model. (F) A 2-Mb zoom of the predicted Hi-C map for a toy model with 800-kbp-long TADs and about 80 bound extruding factors (for other
examples, see Supplemental Fig. S14). (G) Ensemble-averaged MSDs colored by the relative position of the monomer to the nearest TAD border for the same parameters
as in F. (H) For the example shown in F, 2-Mb zooms in the matrix of pair correlations  for different time lags.


