

Compaction leads to anomalous behavior. (A) Comparison of the predicted Hi-C map (top) and the corresponding time-evolution of the diffusion exponent (bottom) for the mouse Chr 1:128.36–130.88 Mbp region, which includes a 1.52-Mbp-long TAD. (B) MSD for three monomers annotated in A (red: m #1 at the border of TAD, blue: m #2 at the middle of the TAD, green: m #3 outside the TAD) and average MSD for all
the monomers inside the TAD. (C,D) As in A and B but for the Drosophila Chr 2L:15.64–16.4 Mbp region, which includes a 460-kb-long TAD. (E) Typical average MSDs for a TAD predicted by the homopolymer and heteropolymer models (top) and the time-evolution of the diffusion exponent (bottom). For the heteropolymer curve, we computed the minimum exponent αmin, the corresponding time tmin, and the expected diffusion exponent αN in the homopolymer model at tmin. (F) 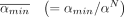 against
  for Drosophila and mice. The symbols are colored by the TAD length, L. (G) tmin as a function of TAD length for Drosophila and mice. Symbols are colored by the compaction level of TADs
  .
.


