
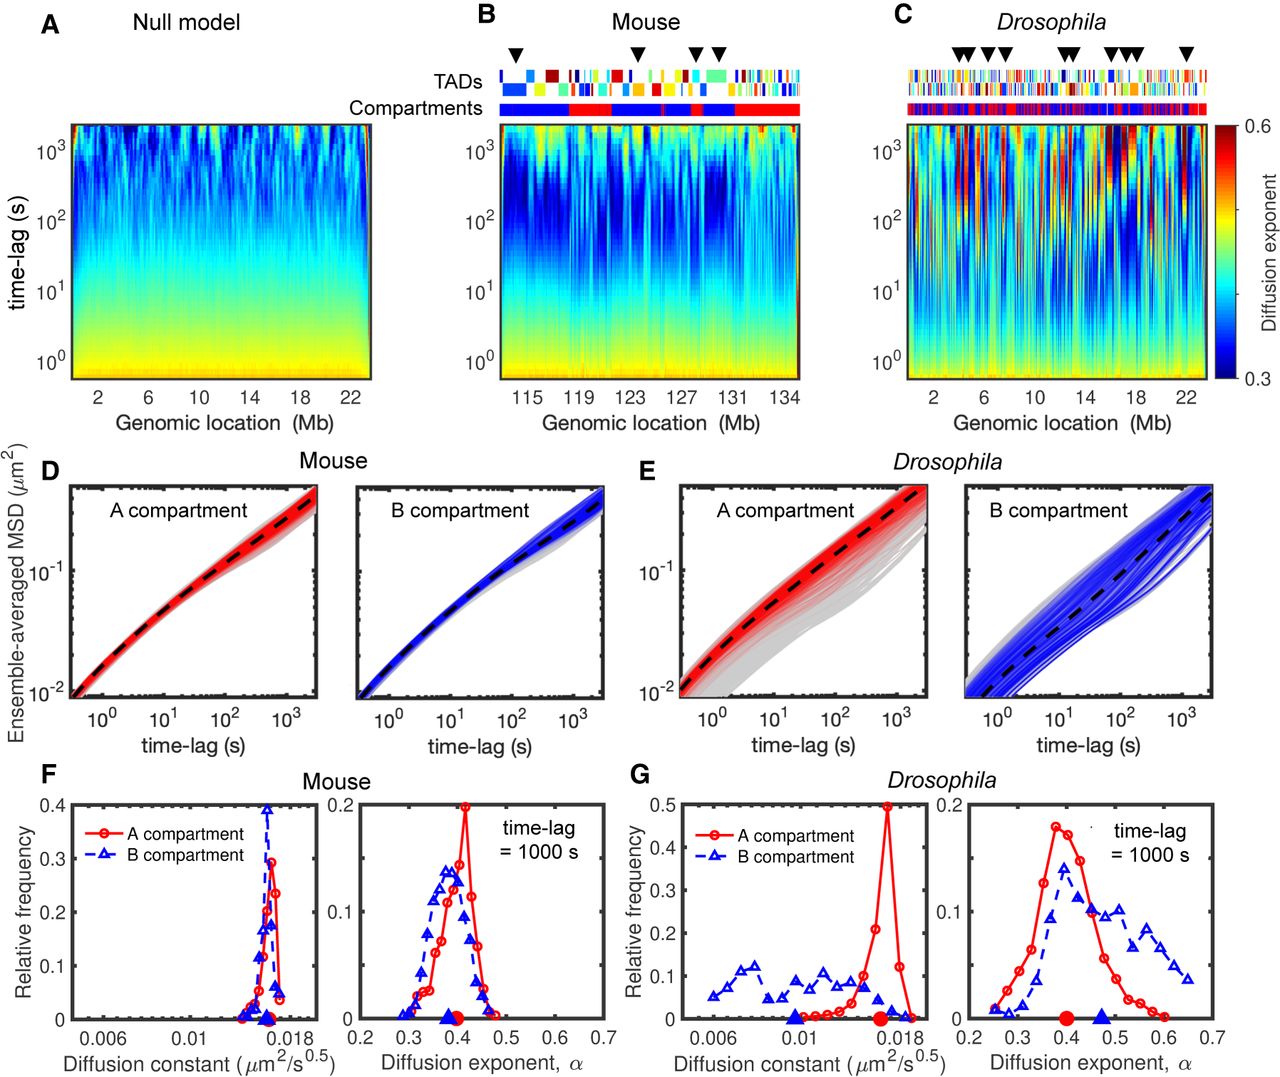
Heterogeneity in dynamics and its relationship with compartments. (A–C) Time evolutions of diffusion exponents along the genome for null model (A), mouse (B), and Drosophila (C), calculated by the derivatives of logarithmic MSD curves (Fig. 3G–I; Methods). The upper tracks in B and C show the corresponding TADs and compartments, and arrows highlight some regions with anomalous behaviors (nonmonotonic evolutions). (D) MSD curves of the monomers in A (left) and B (right) compartments in the mouse case. The dashed black curves show the average MSDs over all loci in the same compartment, and gray shaded areas are MSDs of all monomers. (E) As in D but for the Drosophila model. (F) The distributions of diffusion constant (left) and exponent (right) at 1000-sec time lag for the monomers in A (red) and B (blue) compartments in the mouse case. Their average values are indicated on the horizontal axes. (G) As in F but for Drosophila simulations.


