
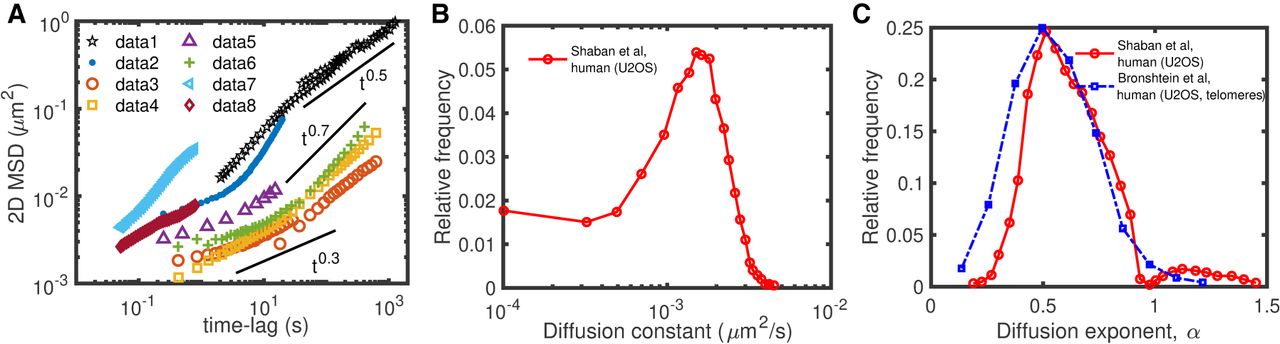
Heterogeneity of chromatin motion. (A) Examples of ensemble-averaged mean-squared displacement (MSD) profiles measured experimentally at individual loci for different organisms and cell lines. The different data sets are from the following: (data1) Mouse pro-B (Khanna et al. 2019); (data2) human MCF-7 (not transcribed gene) (Germier et al. 2017); (data3) human U2OS (centromeres) (Bronshtein et al. 2015); (data4) human U2OS (telomeres) (Bronshtein et al. 2015); (data5) human HeLa cells (Zidovska et al. 2013); (data6) mouse MF (Bronshtein et al. 2015); (data7 and data8) human HeLaS3 (fast loci and slow loci, respectively) (Ashwin et al. 2019). (B,C) Distributions of diffusion constants (B) and diffusion exponents (C) inferred from the time-averaged MSDs of different loci measured in human U2OS cells; data extracted from Bronshtein et al. (2015) and Shaban et al. (2020b).


