
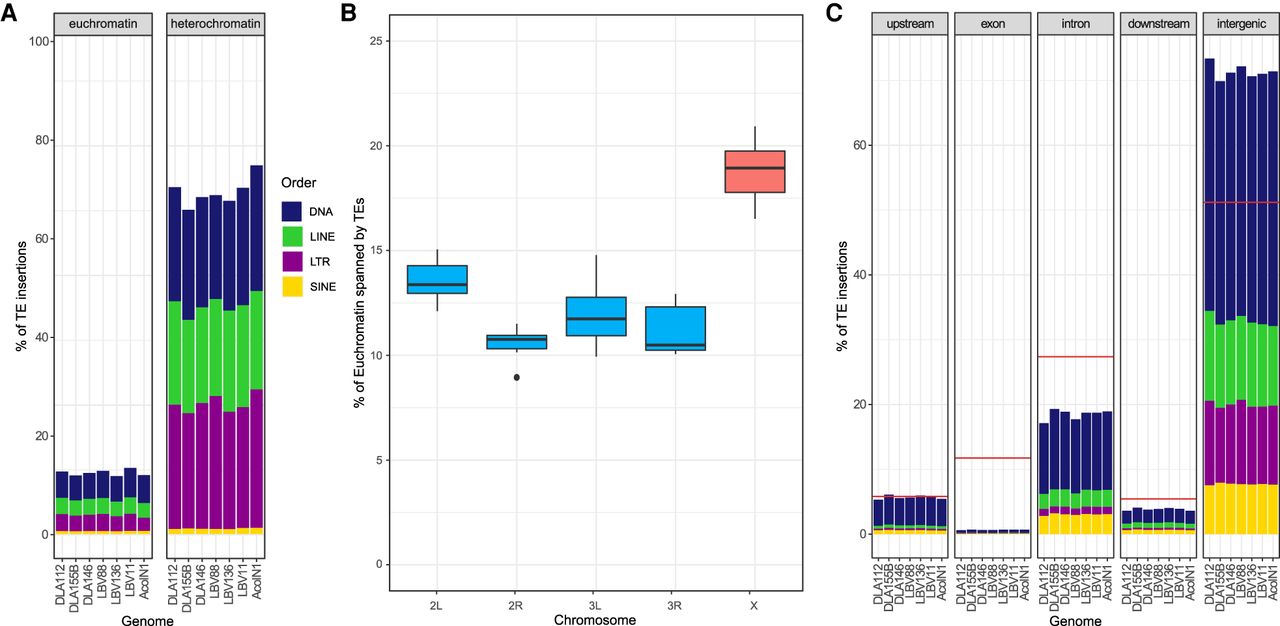
TE insertion distributions throughout the genomes. (A) Percentage of euchromatin and heterochromatin occupied by TEs in each of the seven analyzed genomes. Each order is shown in a different color. (B) Box plots of the percentage of the euchromatin of each chromosome covered by TEs. Autosomes are shown in blue, and the X Chromosome is in red. (C) Percentage of TE insertions in each genome that fall in a specific genomic region. A red line is used to display the expected percentage that should be covered by TEs taking into consideration the size of the genomic region. Each order is shown in a different color as in A. Significant differences were found across orders and superfamilies (Supplemental Table S5).


