
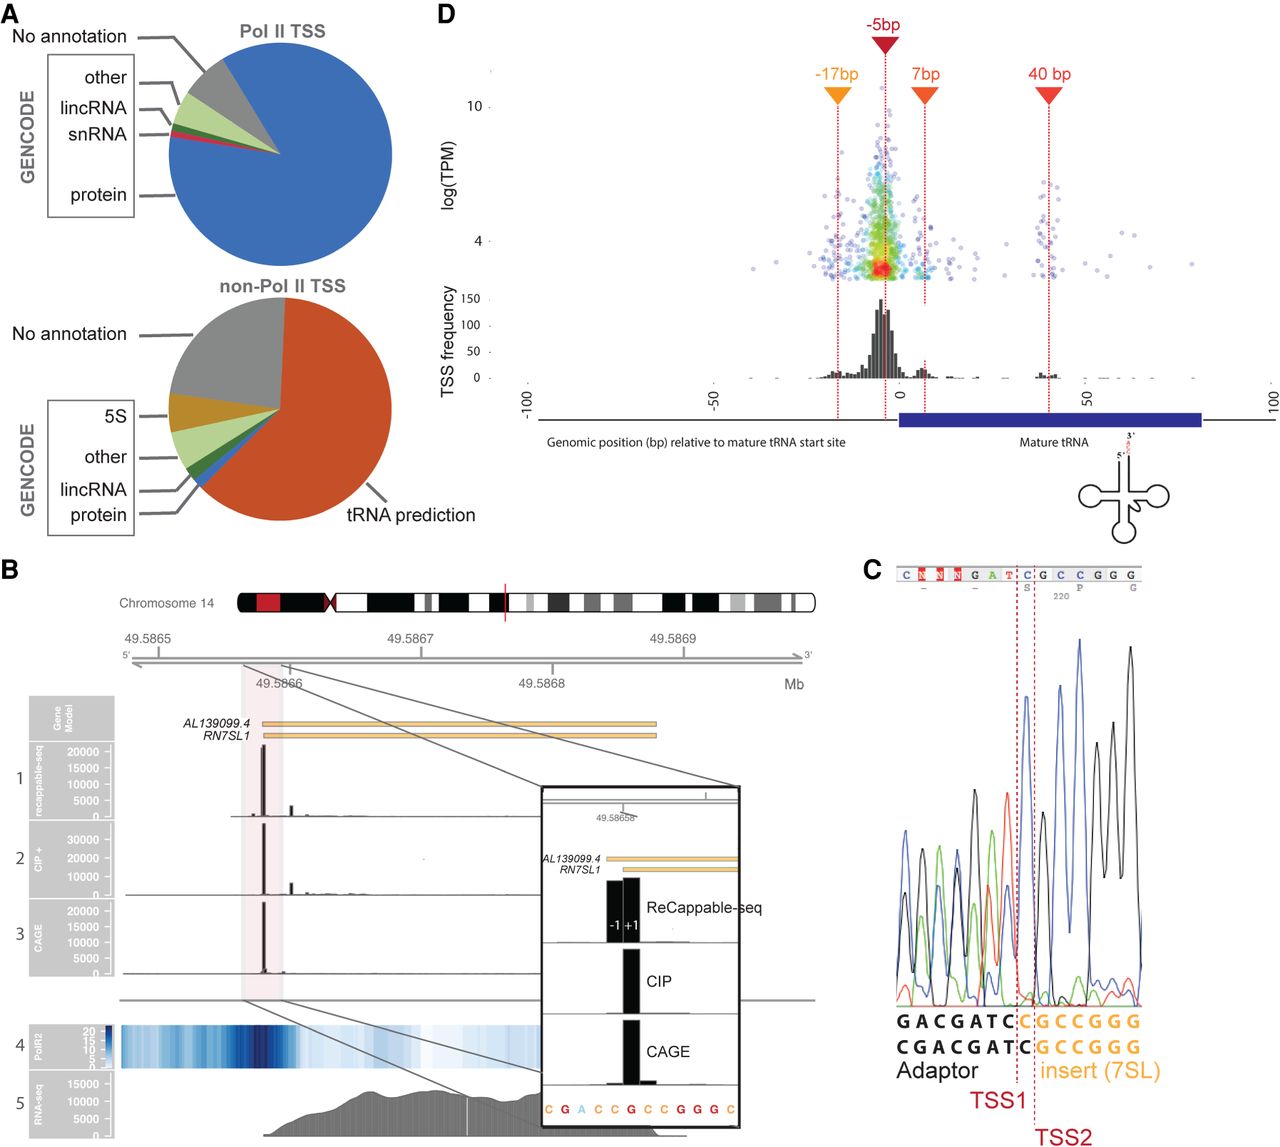
Pol II and non–Pol II TSS distribution. (A) Pie charts representing the proportion of TSSs associated with GENCODE genes, associated with predicted tRNAs (orange), or not associated with any annotation (gray) for Pol II (upper chart) and non–Pol II (lower chart). (B) RN7SL1 locus showing the distribution of the 5′ end of mapped reads for ReCappable-seq (track 1), CIP-treated ReCappable-seq (track 2), CAGE (track 3), Pol II ChIP-seq (track 4, read density), and RNA-seq reads (track 5). Libraries in tracks 1, 2, and 3 were down-sampled to the same number of total mapped reads. The floating panel represents a close up of the 5′ end of the RN7SL1 with two TSS at −1 and +1 of the annotated RN7SL1. The 5′ mapped end of the reads is shown for ReCappable-seq (track 1), CIP-treated ReCappable-seq (track 2), and CAGE (track 3) to mark the TSS positions. (C) Validation of the two TSSs identified for RN7SL1 using RACE. The amplified fragments were directly sequenced using Sanger sequencing with a primer located in the RN7SL1 gene (Methods). The sequencing trace reveals two products ligated to the RACE adaptor resulting from two alternative transcript starts corresponding to TSS1 and TSS2. (D) Non–Pol II TSSs flanking tRNA annotations. The top panel visualizes individual non–Pol II TSSs relative to the 5′ end of the annotated mature tRNA (in bp) as a function of the TPM. The bottom panel represents the distribution of the non–Pol II TSSs relative to the start of the annotated tRNA starts (in bp).


