
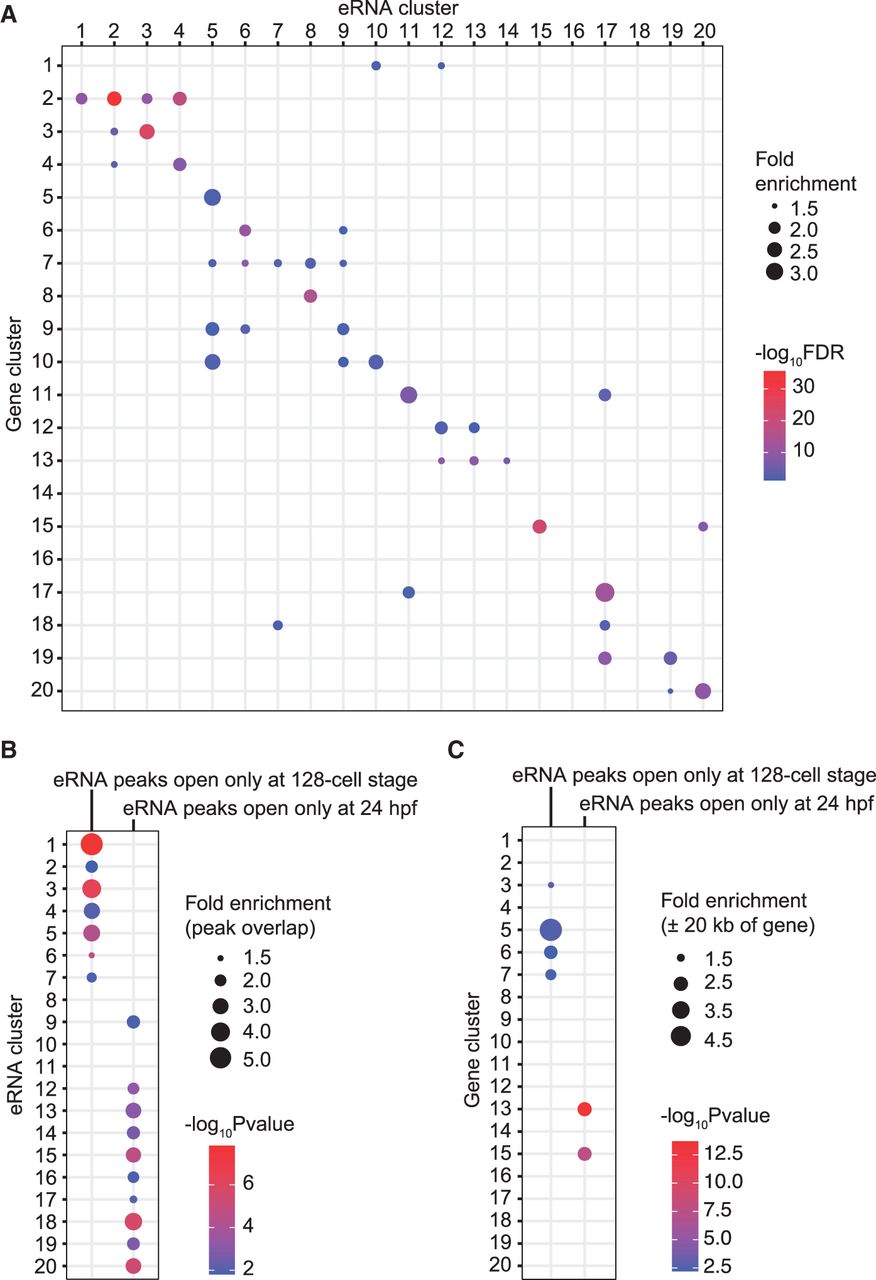
Expression pattern correlation analysis of eRNAs and nearby genes (cluster analysis summarized in Supplemental Fig. S6). (A) Fold enrichment of clustered eRNAs within 20 kb of genes in “parental” or other clusters (compared with total eRNAs in this analysis) is represented by the circles, and the color of the circles correspond to the significance of the enrichment, expressed as −log10(FDR). Only cluster pairs that show greater than 1.5-fold enrichment and FDR < 0.05 are shown. (B) Analysis of eRNA peaks that are exclusively accessible at the 128-cell stage (128-cell eRNAs) or 24 hpf (24 hpf eRNAs) to overlap with eRNA peaks from different temporal expression clusters. (C) Analysis of eRNA peaks that are exclusively accessible at the 128-cell stage or 24 hpf to be within 20 kb of clustered genes. Fold enrichment is represented by the size of the circles, and the colors correspond to the significance of the enrichment, expressed as −log10(P-value). Only enrichments that show greater than 1.5-fold enrichment and P < 0.05 are shown.


