
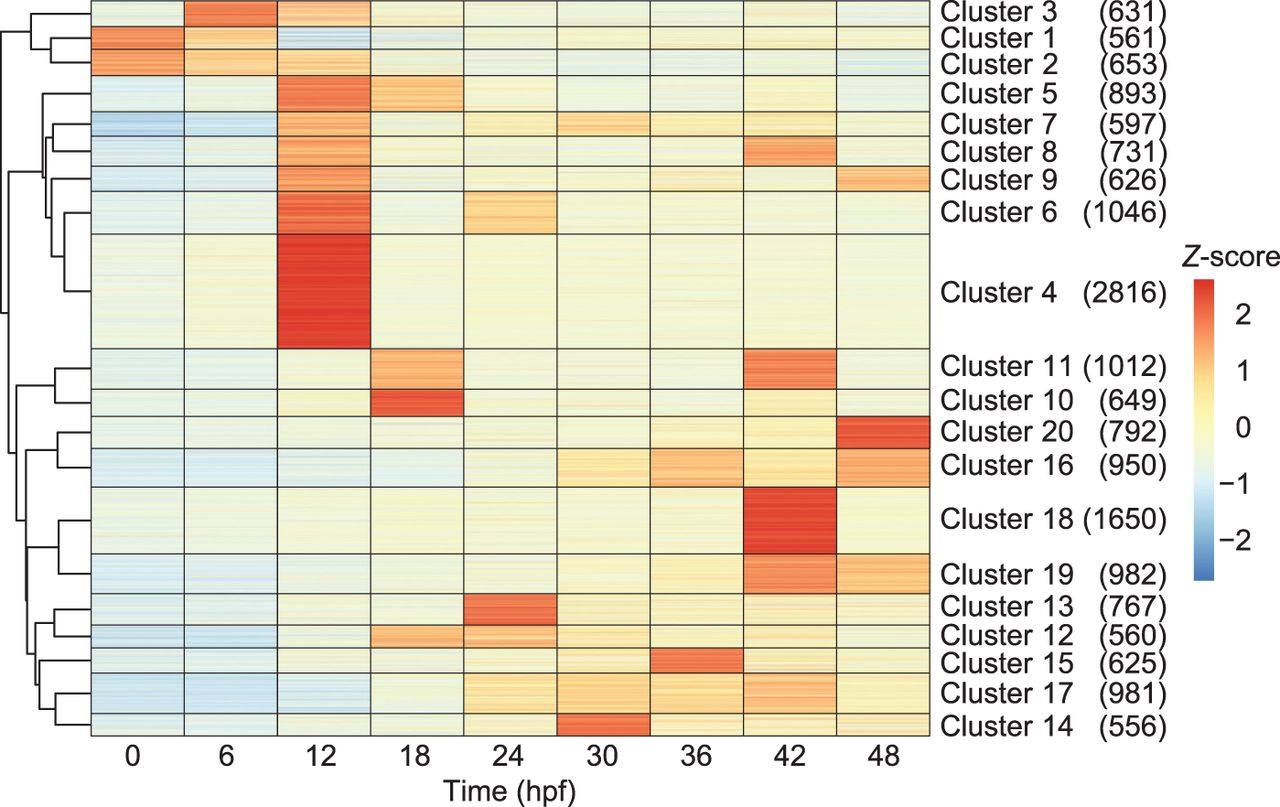
Figure 3.
Heatmap based on k-means clustering (K = 20) of eRNA temporal expression profiles. The number of eRNAs in each cluster is shown in parentheses.
(Downloading may take up to 30 seconds. If the slide opens in your browser, select File -> Save As to save it.)
Click on image to view larger version.
Heatmap based on k-means clustering (K = 20) of eRNA temporal expression profiles. The number of eRNAs in each cluster is shown in parentheses.
 CiteULike
 Delicious
 Digg
Digg Facebook
 Google+
 Reddit
 Twitter
