
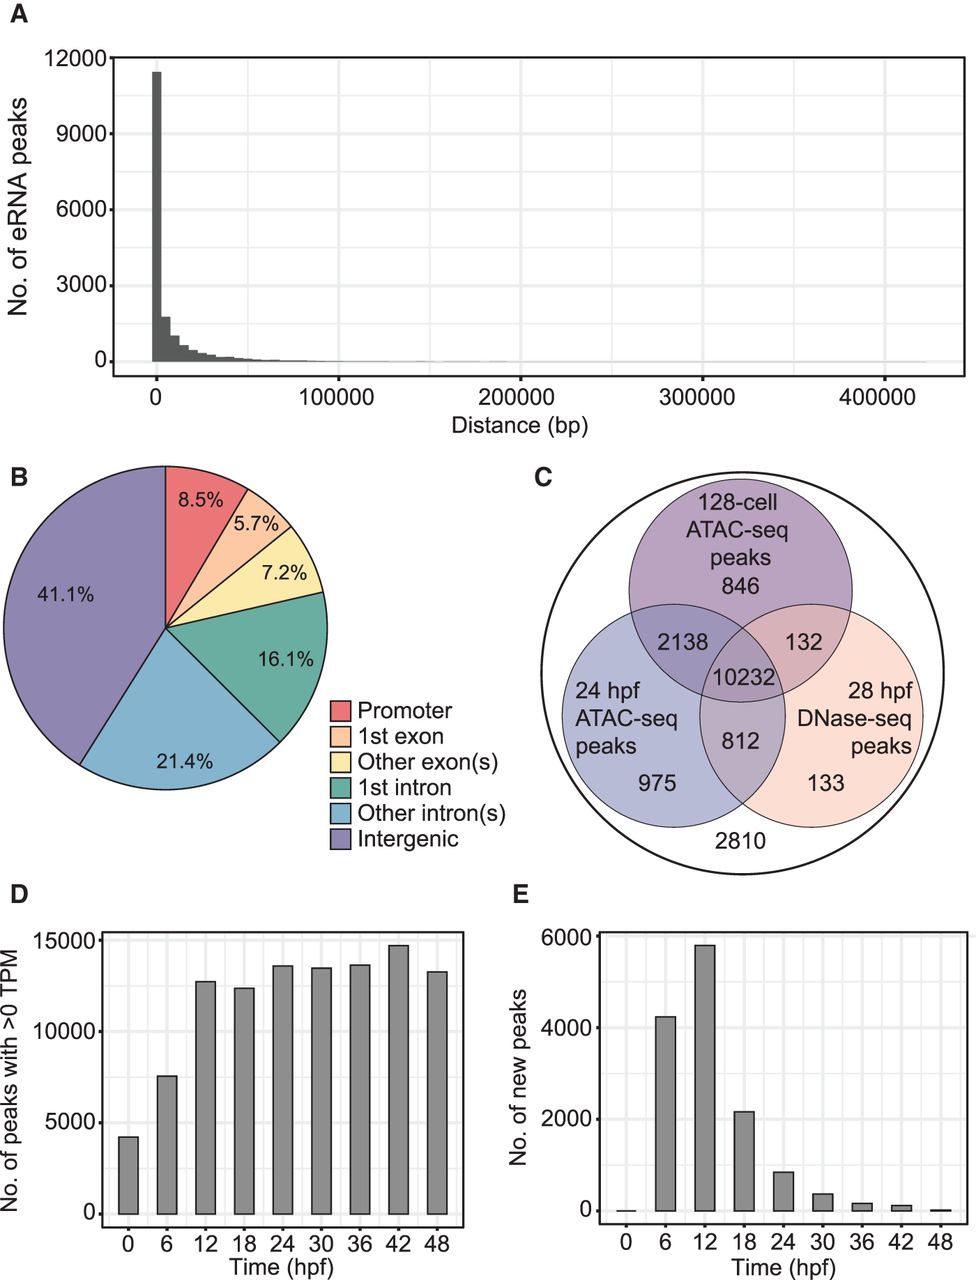
Figure 2.
Annotation and analysis of eRNA peaks. (A) Frequency histogram illustrating peak-to-gene distances, with each bar representing 5000 bp. (B) Pie chart showing the location of eRNA peaks relative to nearest annotated gene. (C) Venn diagram showing the distribution of eRNA peaks that overlap with regions of chromatin shown to be hyperacessible at 128-cell stage and 24 hpf by ATAC-seq and at 28 hpf by DNase-seq (Shashikant et al. 2018). (D) Total number of eRNAs (greater than zero TPM expression) at each time point. (E) Number of newly-appearing eRNAs at each time point.


