
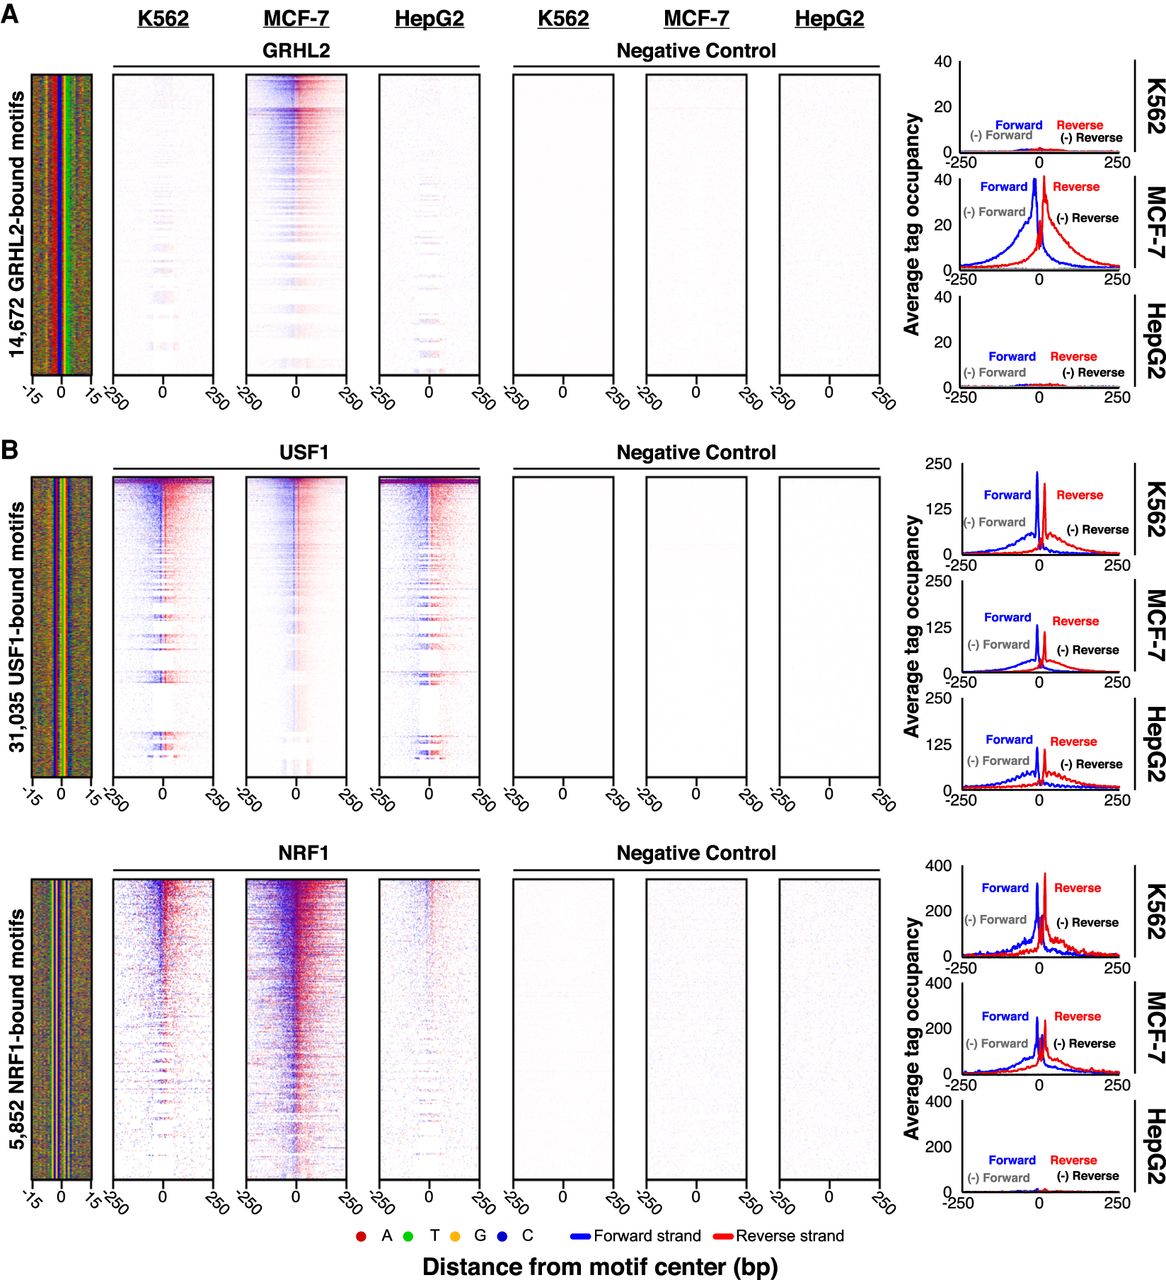
Cell type comparison of antibody performance. (A,B) ChIP-exo heatmap, composite, and DNA-sequence four-color plots are shown for the indicated number of bound motifs for the indicated targets, in the indicated cell types. The 5′ end of aligned sequence reads for each set of experiments was plotted against the distance from the cognate motif, present in the union of all called peaks among the data sets for each indicated target. Reads are strand-separated (blue, motif strand; red, opposite strand) and total-tag-normalized across samples. Rows are linked across samples and sorted based on their combined average in a 100-bp bin around each motif midpoint.


