
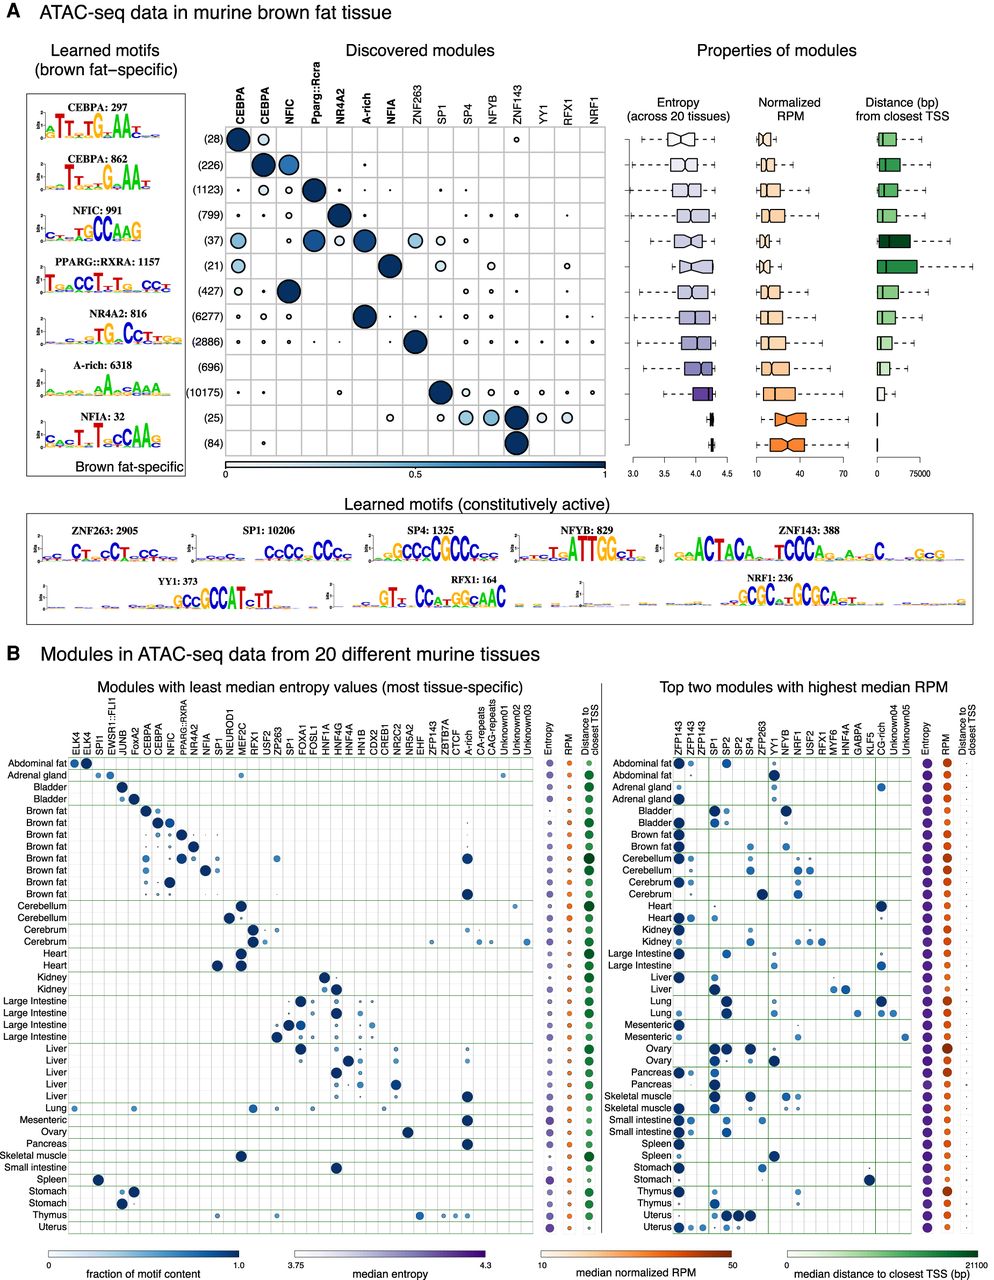
cisDIVERSITY run on accessible regions in mouse tissues. (A) Thirteen modules are learned in ATAC-seq regions from the brown fat tissue, sorted according to median entropy (most brown fat–specific on top). The 15 discovered motifs can be split into two sets: those that are enriched in tissue-specific regions, that is, those with median entropy value less than 4.0, and those that are constitutively active. Boxplots on the right indicate the relationship between tissue specificity, accessibility, and proximity to TSSs. (B) Left panel shows modules with the lowest median entropy for each tissue. Many tissues have multiple modules with lower than 4.0 median values: All such modules are shown. Motifs that are present in at least 10% of the sequences in any module are shown. The right panel shows the top two modules based on highest median RPM values per tissue. Median entropy, RPM, and distance to closest TSS are displayed on the right for each module. TOMTOM matches were used to assign putative TF identities to motifs and combined across the cisDIVERSITY individual runs.


