
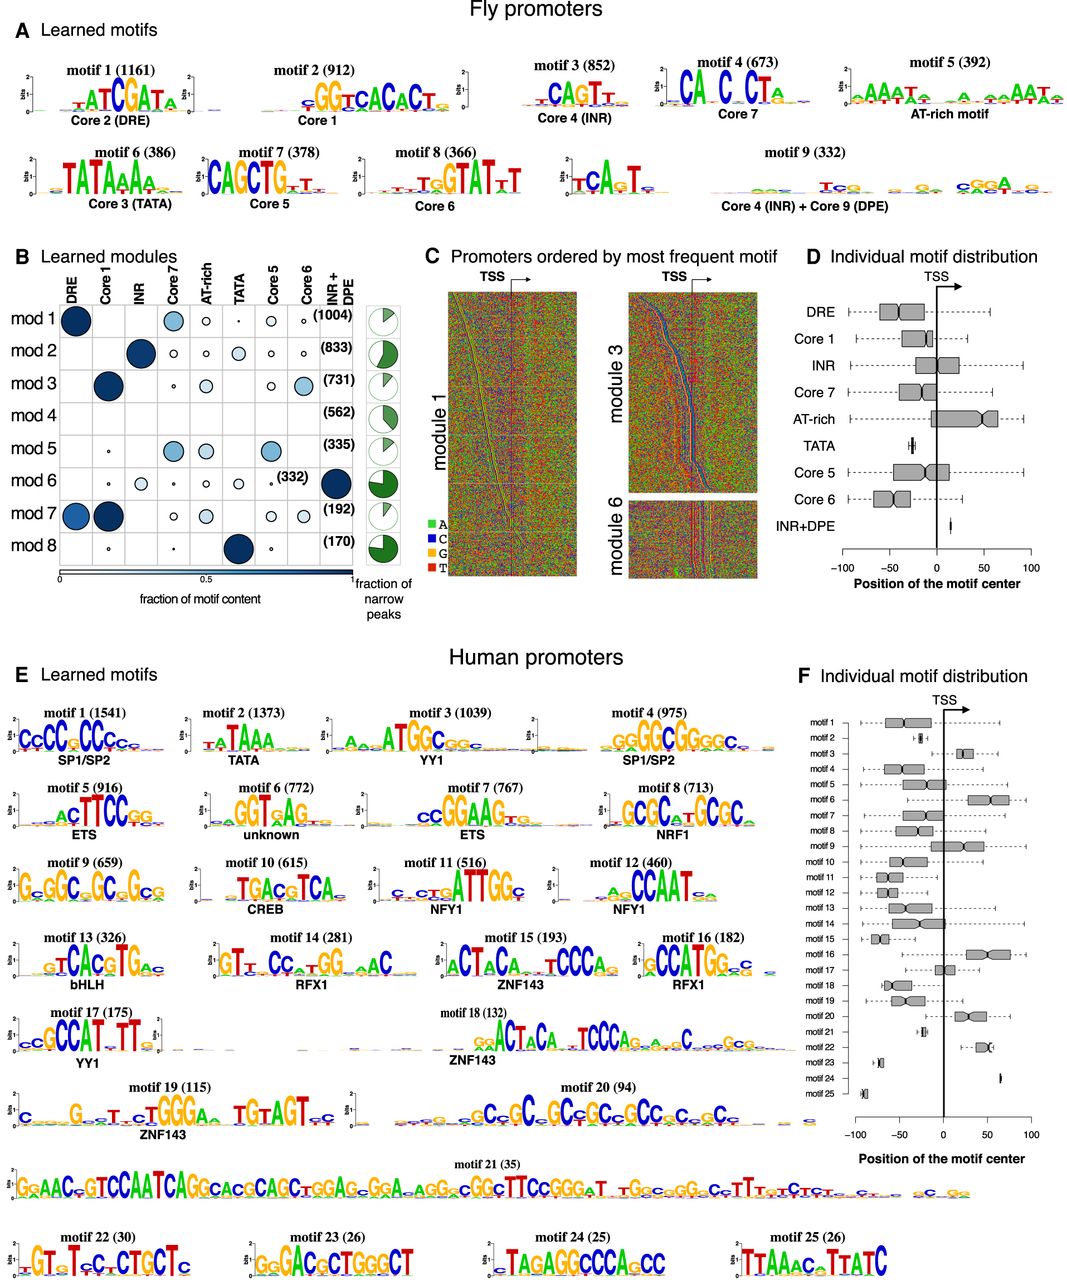
Promoter modules in fly and human. (A) cisDIVERSITY identifies 24 motifs in fly promoter data, but only the nine that contribute to at least 20% of some module are shown here. Core motifs are numbered according to the method of Ohler et al. (2002). (B) Eight modules are learned. The fraction of sequences in each module that are focused promoters, namely, have a narrow peak are shown in green. (C) Three representative modules are shown as sequence heat maps sorted based on the position of the most frequently occurring motif. Module 1 contains DRE, which is visible owing to the manner in which the sequences were ordered, but Core 7, which is present in >40% of the sequences, is not visible because it has no clear positional relationship with DRE or the TSS. The weak presence of the AT-rich motif downstream from the TSS is, however, visible. In contrast, module 3 displays a clear relationship between Core 1 and Core 6: Core 6 is present about 20 bases upstream of Core 1 and is especially prominent when Core 1 is close to the TSS. Module 6 is largely composed of INR + DPE but also contains the TATA box specifically when the INR + DPE is a few bases downstream from the TSS. (D) Each motif has a distinct distribution about the TSS. (E) cisDIVERSITY identifies 25 motifs in pooled human promoter data, with motifs 21–25 contributing on one module with TSSs of 37 zinc finger genes. All the other motifs are strand invariant, except for motif 2 (TATA) and motif 6 (unknown). (F) Each motif here too has a distinct distribution about the TSS.


