
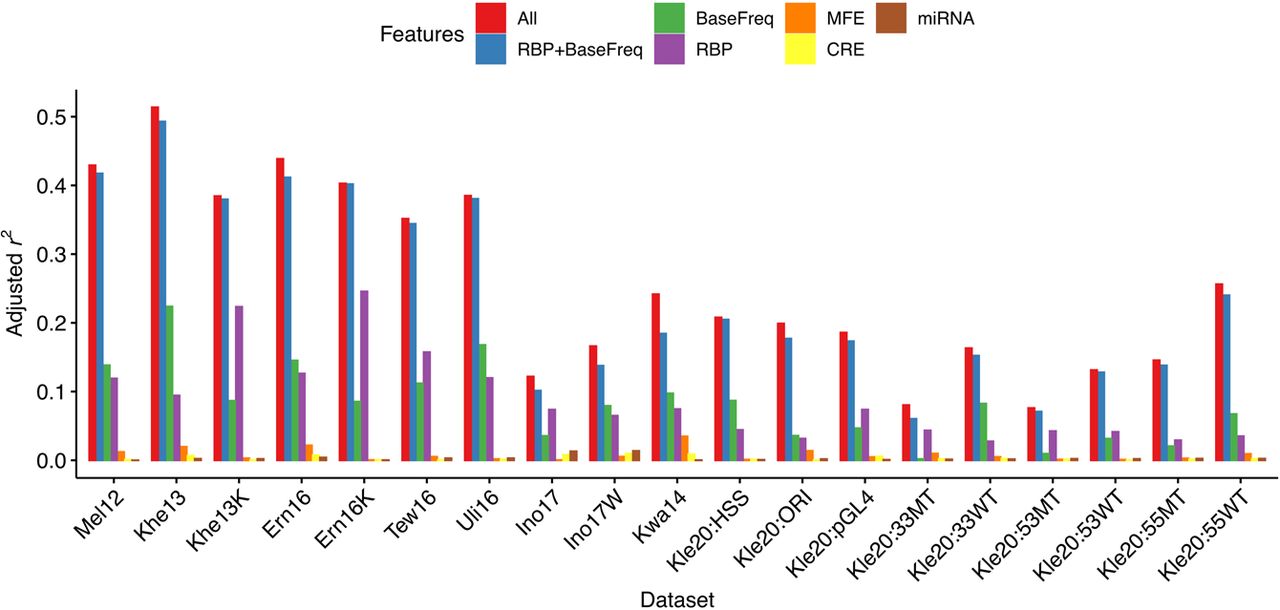
Variation in relative tag expression is explained in part by RBP binding sites and base frequencies in tags. Multivariate linear regression analyses were performed using five different biological feature sets. We used residuals of predicted expression for the individual feature set analysis after correcting for other features. BaseFreq and RBP are the two most dominant feature sets. (BaseFreq) base counts in tag sequences; (MFE) minimum free energy of mRNA secondary structures; (CRE) tags as cis-regulatory elements; (miRNA) microRNA binding sites; (RBP) RNA-binding protein binding sites; (RBP + BaseFreq) RBP and BaseFreq features combined; (All) all features combined.


