
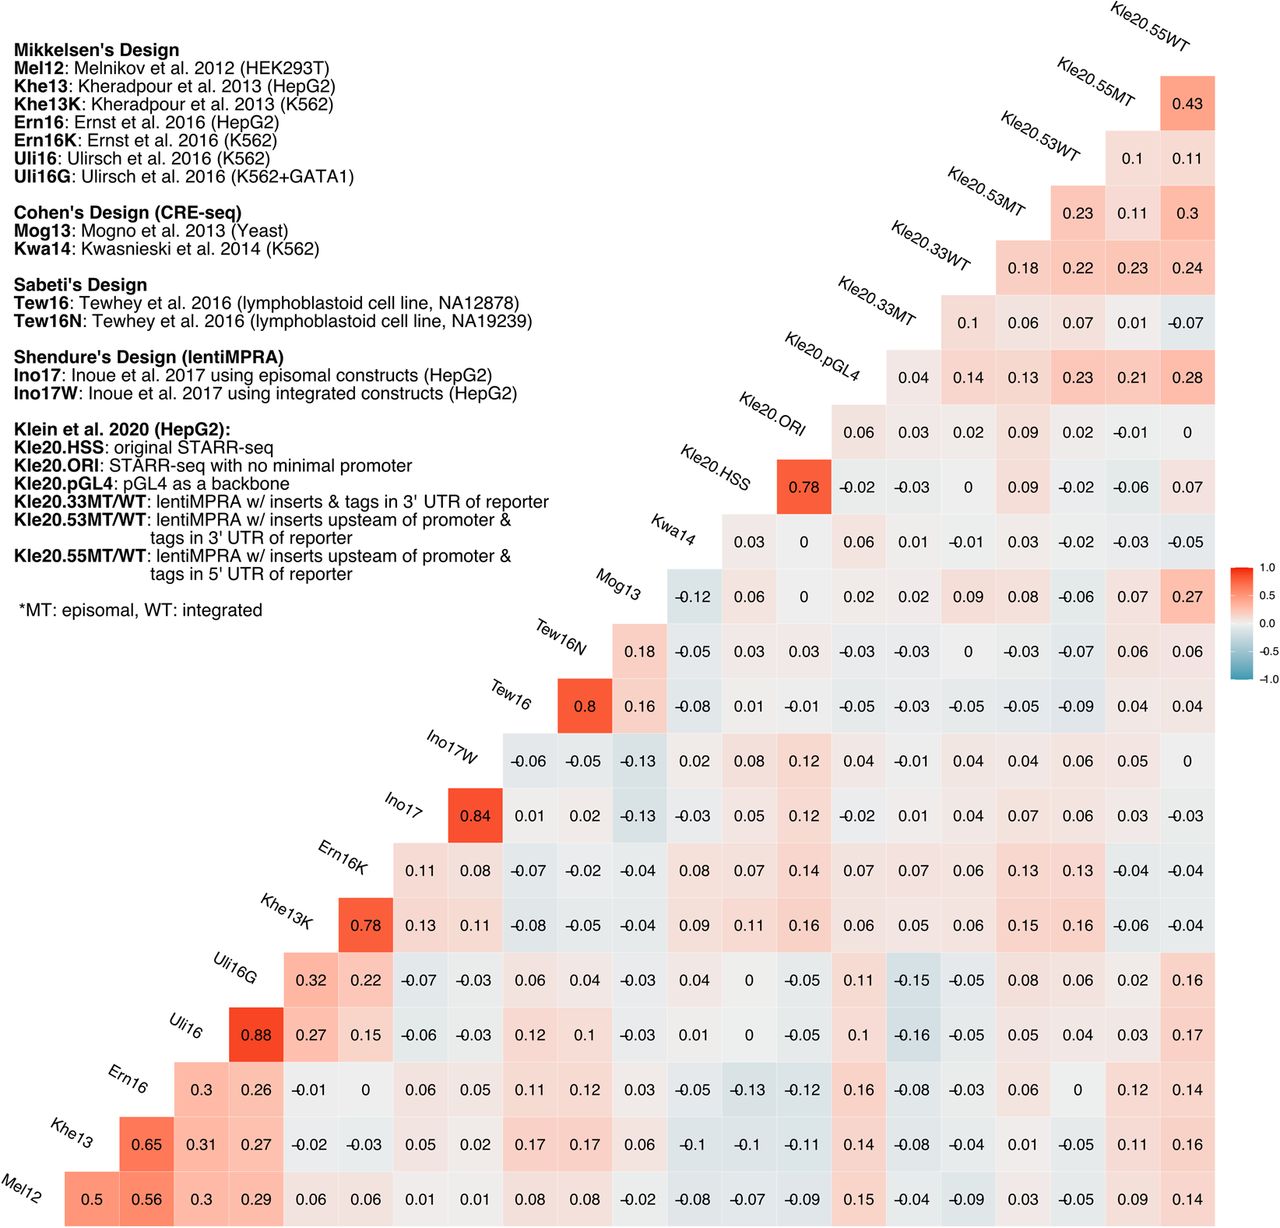
Figure 4.
Pairwise Pearson's correlations between the 21 data sets using trained 8-mer SVR weights. Differences in the MPRA designs and cell types are major determining factors of the tag sequence effects. Pearson correlation coefficients are shown in the matrix.


