
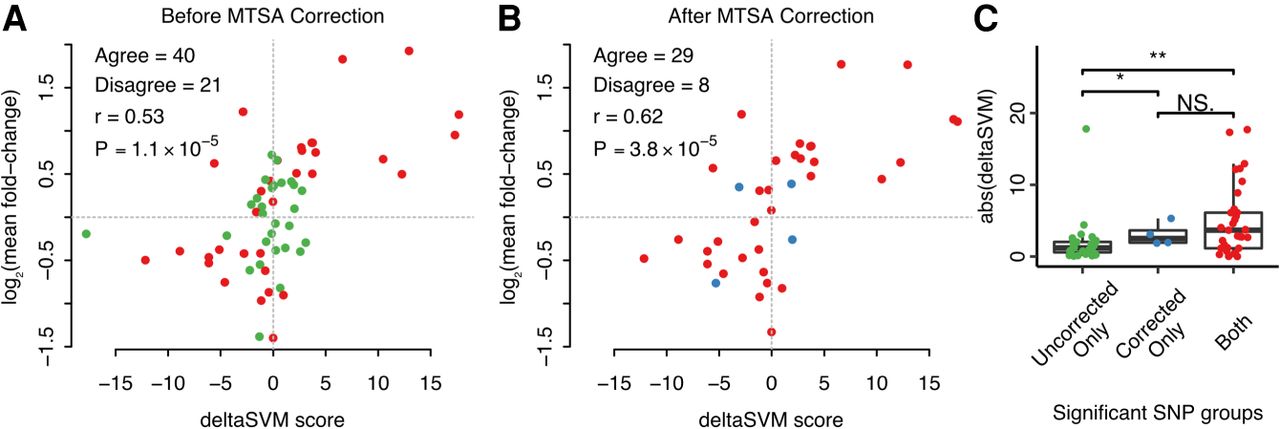
MTSA correction improves the identification of regulatory variants. (A,B) MTSA correction not only significantly reduces false positive identification but improves the correlation between deltaSVM and MPRA expression (from 0.53 to 0.62): log2 fold changes using raw expression (A) and MTSA-corrected expression (B) are compared to their deltaSVM scores. SNPs detected by both are highlighted in red. (C) Predicted impact on CRE activity by deltaSVM is compared by group: significant SNPs without MTSA correction only (green), significant SNPs with MTSA correction only (blue), significant SNPs both with and without MTSA correction (red). The significant SNPs after MTSA correction (blue and red) are more explainable by their sequence changes (i.e., larger absolute deltaSVM values). One-sided Mann–Whitney U test results are shown: (*) P < 0.05; (**) P < 0.005.


