
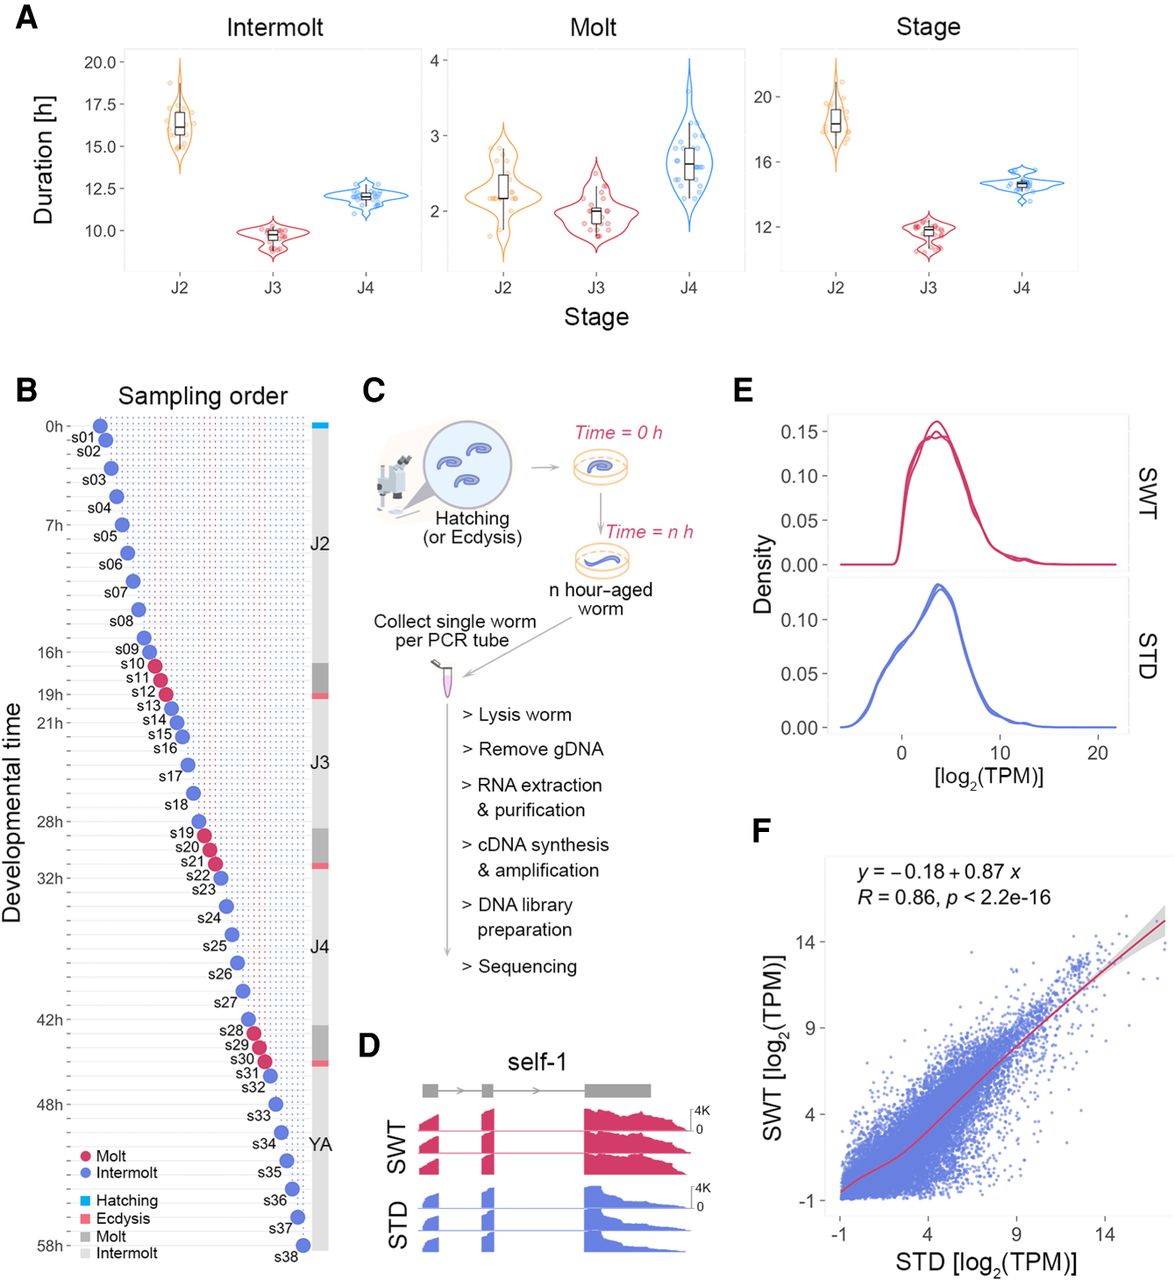
Single worm transcriptomic (SWT) sequencing in P. pacificus. (A) The violin plots display the duration of intermolt, molt, and the whole stage for all three juvenile stages (J2, J3, and J4). The head structure of the wild type at hatching, lethargus, and ecdysis is shown in Supplemental Figure S1. (B) The schematic shows the distribution of time points for SWT samples, which cover 58 h of postembryonic development from hatching to young adults. The three time points of each molt indicated in red represent the substages of molting: lethargus, apolysis, and ecdysis, respectively (for visualization, see Supplemental Fig. S1). Animals were collected hourly or every 2 h in the molt or intermolt stage. (C) Schematic summary of the workflow for SWT. (D) RNA-seq read coverage is visualized at the self-1 locus using the Integrative Genomics Viewer (IGV) (Robinson et al. 2011) as one example for comparing SWT and standard RNA-seq (STD). (E) Density of gene expression of SWT and STD samples, six replicates each. (F) The scatterplot shows the correlation of the mean TPM of individual genes between SWT and STD data at the lethargus of the fourth molt. Three biological replicates for each method.


