
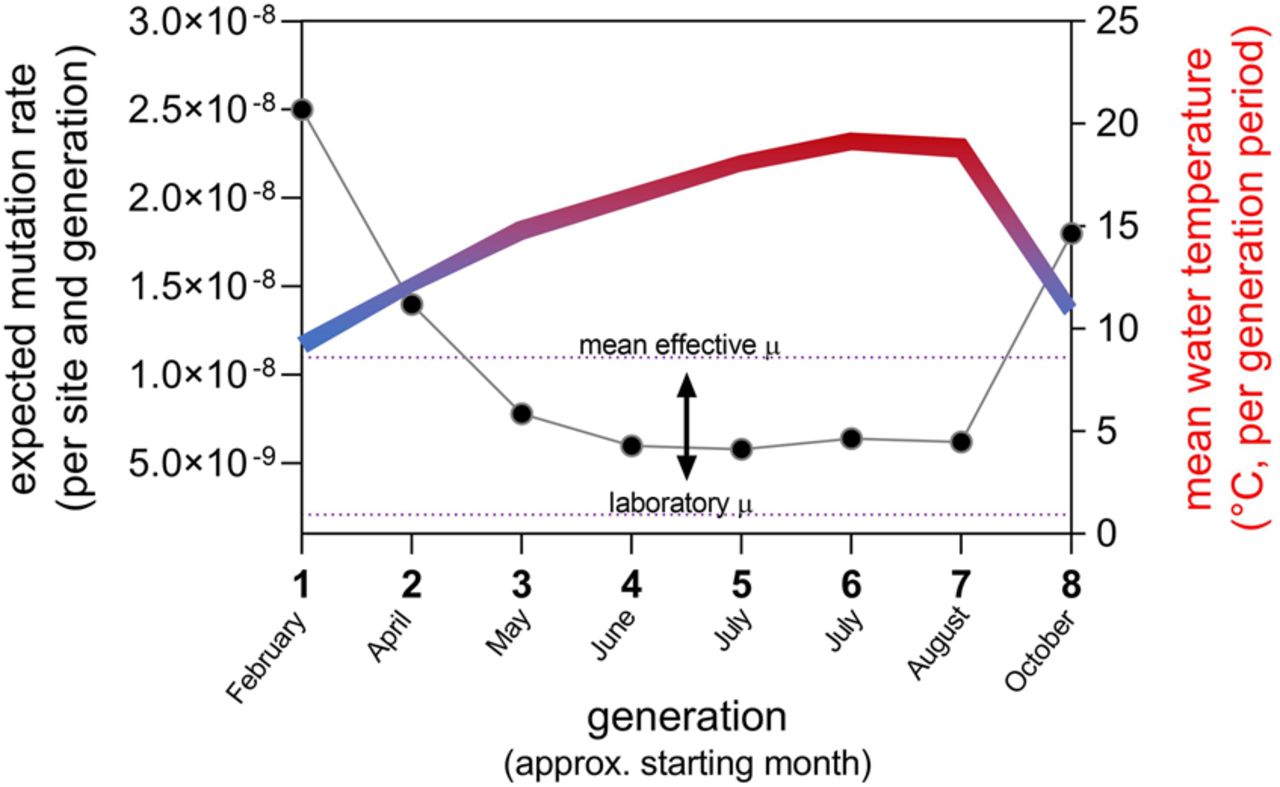
Figure 4.
Expected variation of mutation rate calculated per generation for a natural C. riparius field population (left y-axis) with regard to the annual variation in water temperature (Hasselbach in Hesse, Germany) averaged for each generation period (right y-axis). Due to the temperature-dependence of generation times, C. riparius can pass eight generations per year (x-axis). The mean effective µ is 5.29-fold higher than µ measured under laboratory conditions (indicated by arrow) (Oppold and Pfenninger 2017).


