
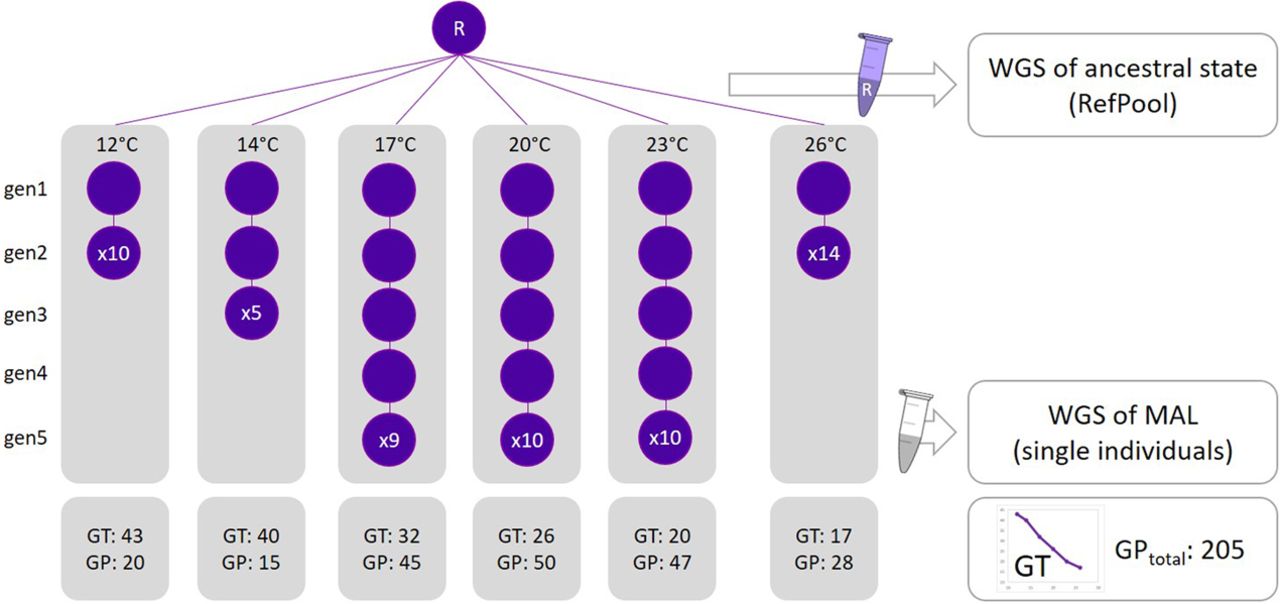
Figure 1.
Experimental setup of mutation accumulation at different constant temperatures. The succession of circles indicates how many generations (F1–F5) could be passed under the different temperature conditions. Circles are labeled with the total number of MALs that survived until the respective generation. Mean generation time (GT) is decreasing with increasing temperature as indicated in the detail graph. Number of generational passages (GP = MALs × generation) sums up to a total of 205 (excluding GPs of mutator lines).


