
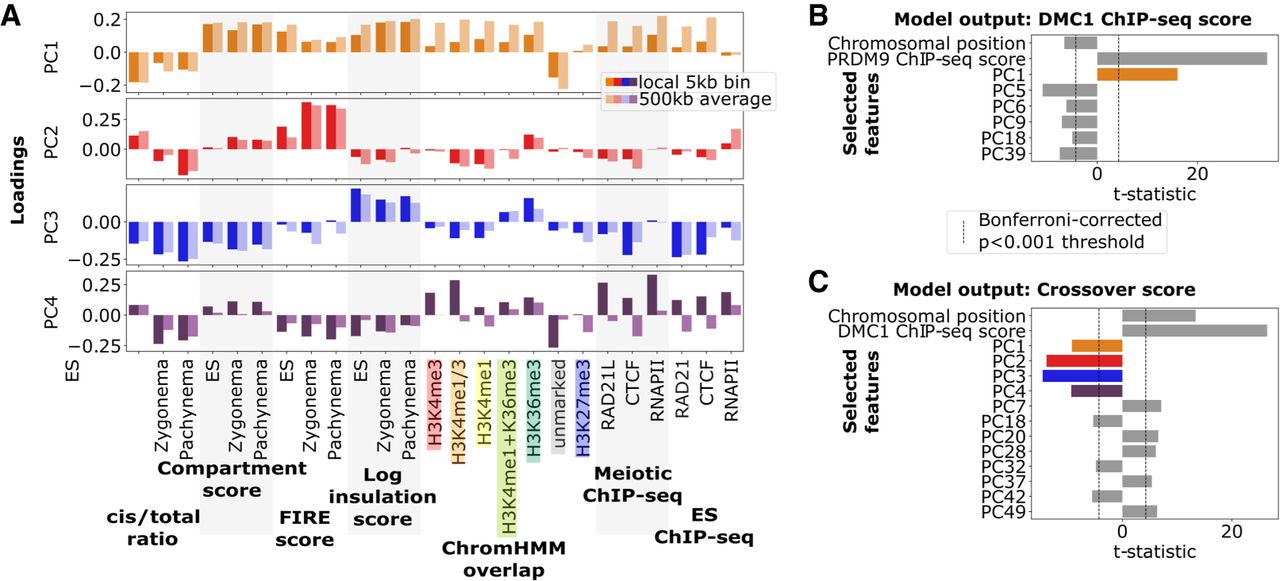
Principal component analysis (PCA) with linear model reveals variable chromatin organization at PRDM9 and DSB sites and its relationship with recombination activity. (A) Loadings for the top four principal components (PC1–PC4) of variation at joint PRDM9–DSB sites based on underlying chromatin organization variables (horizontal axis). Two values of each variable were included: one measuring local value at the joint PRDM9–DSB site and the other a 500-kb average around the site. Positive PC1 loadings reflect presence of active chromatin, which is typically characterized by a low cis/total ratio, high compartment, FIRE, and insulation scores, as well as increased histone modifications, RAD21L cohesin subunit, and RNAPII. Positive PC2 loadings indicate the presence of H3K36me3 histone marks typical of gene bodies, which tend to colocalize with increases in FIRE score, as well as meiotic-specific decreases in cis/total ratio. PC3 reflects divergence from the typical correlation between activity and spatial accessibility: Specifically, positive PC3 loadings indicate chromatin regions that are more spatially accessible (lower cis/total ratio) than expected given their activity (compartment score). Positive PC4 loadings indicate strong local enrichment of RAD21L/CTCF/RNAPII, characteristic of occupancy sites. (B) Results from a linear model for DSB activity (quantified by DMC1-SSDS ChIP-seq score) at PRDM9 sites as a function of the principal components described in A and adjusted for centromeric proximity (chromosomal position) and inherent PRDM9 binding variability (PRDM9 ChIP-seq score). Forward selection was used to choose statistically significant principal components to include in the model. Note that the strongest predictors are positive inherent PRDM9 binding strength and positive PC1, reflecting increased DSB formation at PRDM9 sites in active, spatially accessible chromatin. PC colors as in panel A. (C) Results from a linear model with forward feature selection for crossover likelihood at DSB sites as a function of principal components and adjusted for centromeric proximity (chromosomal position) and inherent DSB variability (DMC1-SSDS ChIP-seq score). DMC1-SSDS score and chromosomal position both positively predict crossover formation, reflective of inherent DSB variability and pericentromeric crossover depletion. PC1–PC4 all negatively predict crossover formation, reflecting crossover depletion at DSB sites in active chromatin, particularly at gene bodies, as well as promoters and spatially accessible regions. PC colors as in panel A.


