
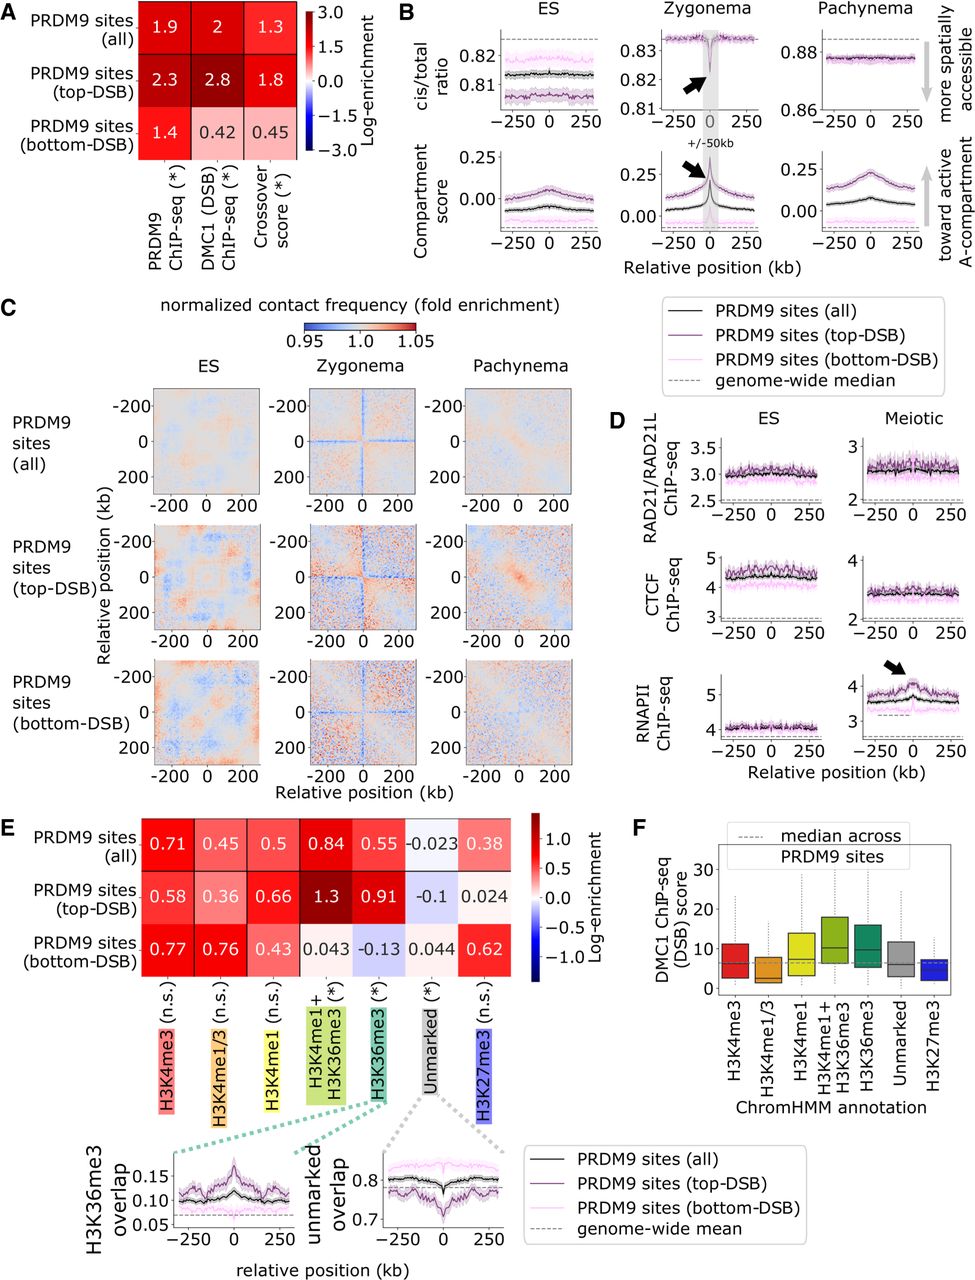
Chromatin environments at PRDM9 sites. (A) Summary of recombination activity at PRDM9 sites, with additional partition into the top and bottom quartiles by DMC1-SSDS ChIP-seq score, measuring DSB activity. Top (i.e., DSB-favored) sites have more bound PRDM9 and greater likelihood of crossover formation. Heatmap shows log fold enrichment over genome median, and an asterisk indicates a Bonferroni-adjusted P < 0.01 difference between top and bottom partitioned sites. (B) Hi-C cis/total ratio (top) and compartment score (bottom), symmetric-averaged across PRDM9 sites, calculated for ES, zygonema, and pachynema data sets. Shading represents 95% confidence intervals. Top DSB-favored sites are associated with higher compartment score in all data sets and lower cis/total ratio in ES. Black arrows indicate zygomena-specific shifts toward active, spatially accessible chromatin, which are enhanced at DSB-favored sites. (C) Normalized chromatin contact matrices, symmetric-averaged across PRDM9 sites, for embryonic stem (ES) cell, zygonema, and pachynema Hi-C data sets. We observe contact depletion at PRDM9 sites during zygonema and enriched contacts near DSB-favored sites during pachynema. (D) RAD21/RAD21L cohesin subunit (top), CTCF (middle), and RNAPII (bottom) ChIP-seq tracks, symmetric-averaged across PRDM9 sites, calculated for ES cell and meiotic data sets. Elevated RNAPII occupancy during meiosis appears to be associated with increased DSB formation (black arrow). (E) Overlap of ChromHMM histone annotations with PRDM9 sites. Note DSB-favored sites are depleted for unmarked chromatin while enriched for H3K36me3 chromatin typical of gene bodies. Heatmap shows log fold enrichment over genome-wide mean, and an asterisk indicates a Bonferroni-adjusted P < 0.01 difference between most (top) and least (bottom) DSB-favored sites. Insets plot overlap fraction symmetric-averaged around PRDM9 sites; shading represents 95% confidence intervals. (F) Distribution of DMC1 ChIP-seq scores (i.e., DSB activity) at PRDM9 sites split by ChromHMM state. DSB formation is elevated within H3K36me3-marked chromatin characteristic of gene bodies.


