
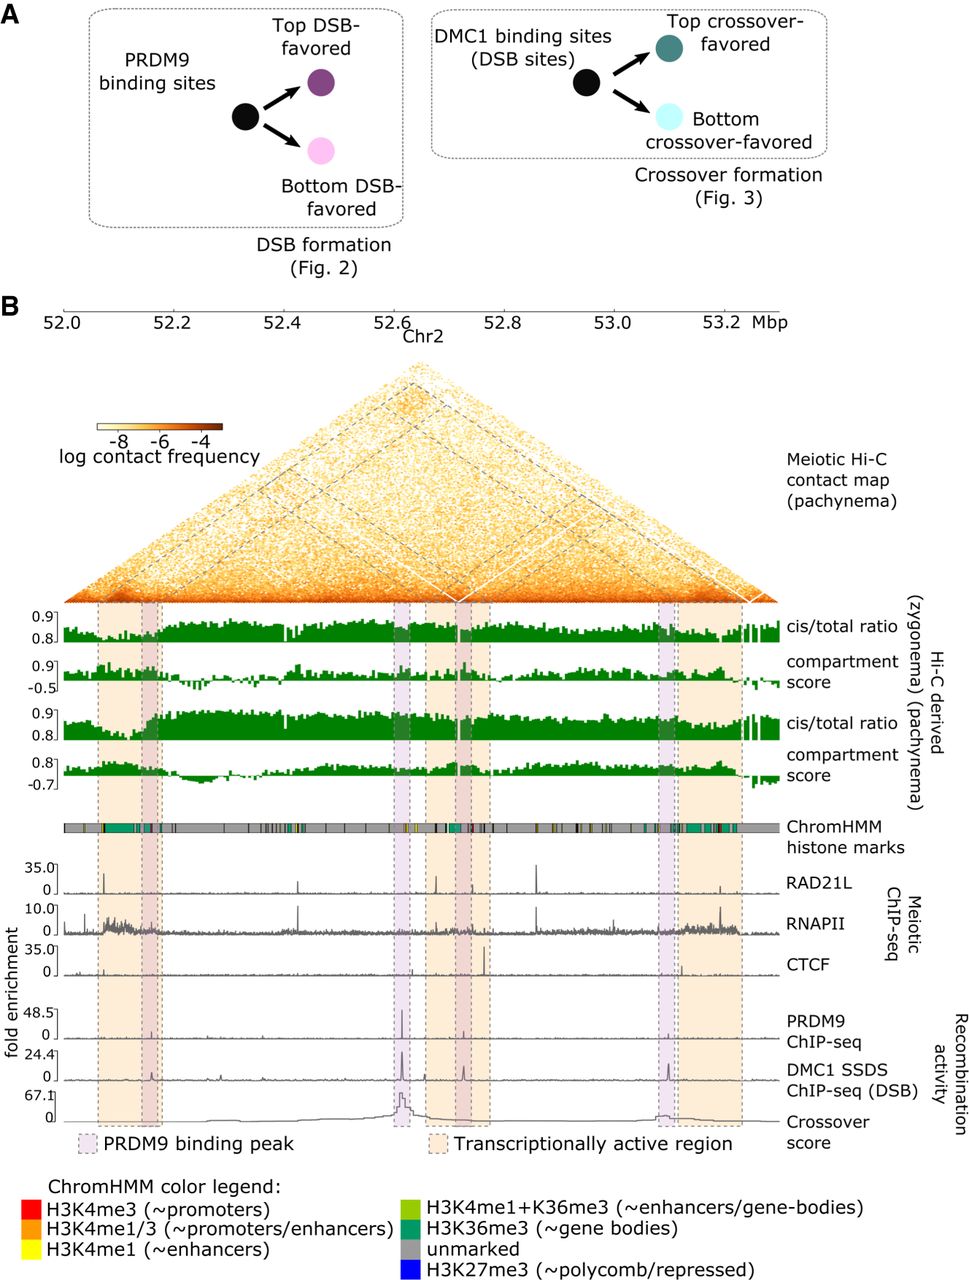
Multiple chromatin organization data sets are integrated with measurements of recombination activity at the levels of PRDM9 binding, DSB, and crossover formation. (A) Overview of recombination-related comparisons explored in this paper. Figure 2 explores chromatin conformation at PRDM9 binding peaks, stratifying based on their likelihood of forming DSBs as measured via DMC1-SSDS ChIP-seq signal. Subsequently, Figure 3 explores chromatin conformation at DMC1-SSDS binding peaks, indicative of DSBs, stratifying based on their likelihood of forming crossovers. (B) Key data sets used in this study (see also Supplemental Section S1), shown in a browser view of a representative 1.3-Mb region on mm10 Chromosome 2. Pachynema Hi-C contact frequencies are shown as a heatmap, in addition to Hi-C-derived cis/total ratio and compartment score for zygonema and pachynema. Hi-C contact information is accompanied by epigenetic chromatin state information using ChromHMM annotations of histone marks in mouse testis (for color legend, see bottom), as well as meiotic ChIP-seq tracks of cohesin subunit RAD21L, RNAPII, and CTCF. Recombination activity measurements include ChIP-seq binding tracks of PRDM9, DMC1 (marking DSBs), as well as crossover likelihood score derived from single-sperm whole-genome sequencing. Several relationships to note in this region: (1) enriched Hi-C contacts between transcriptionally active regions during meiosis, highlighted in orange shaded boxes; (2) colocalized DSB formation and crossover formation at PRDM9 binding peaks, highlighted in purple shaded boxes; (3) differences in DSB and crossover likelihood among PRDM9 binding peaks; and (4) locally depressed cis/total ratio and elevated compartment score at these loci in zygonema. Hi-C bins with missing data are ignored for visualization of maps and derived scores.


