
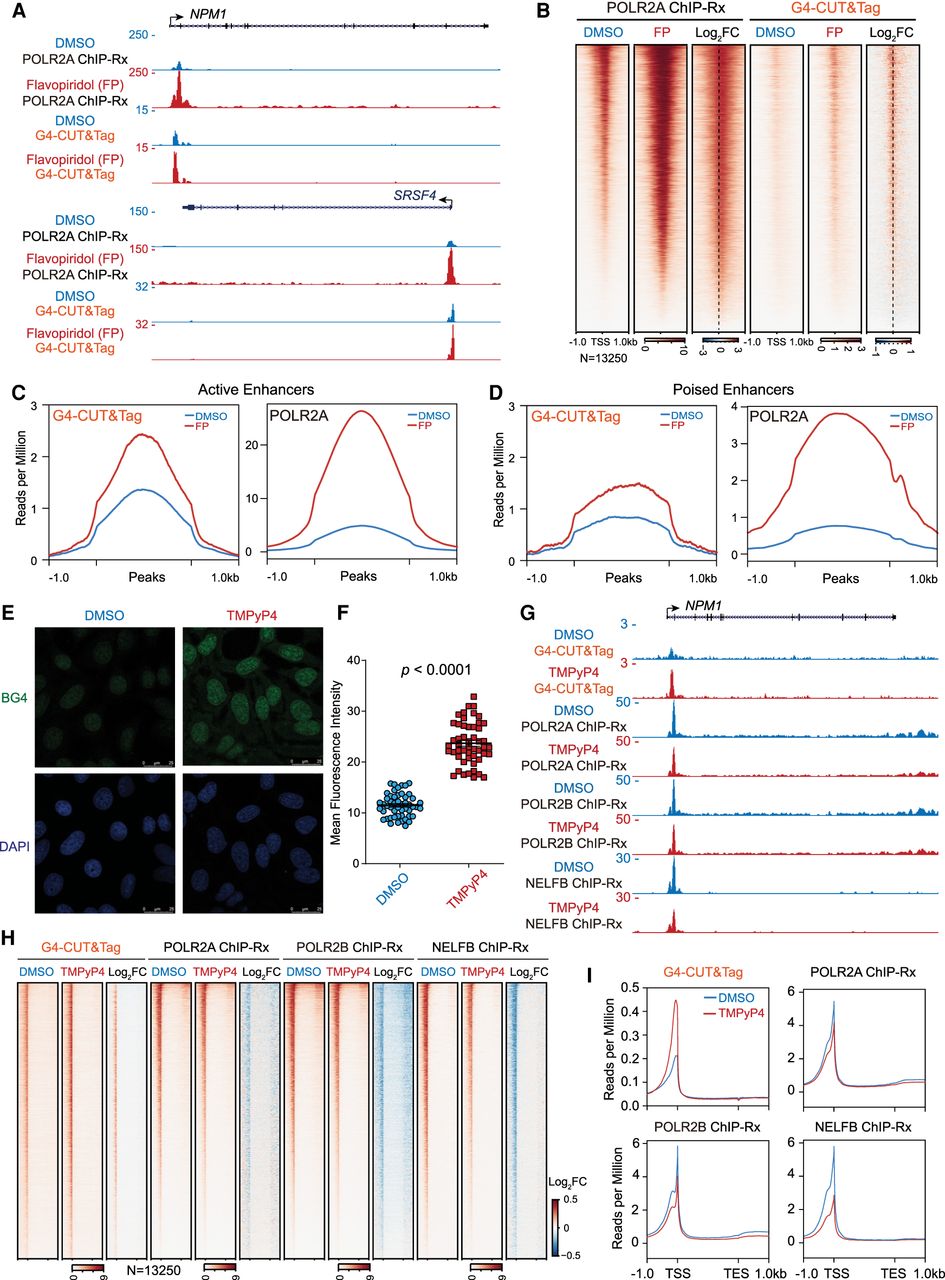
The reciprocal interaction between RNA polymerase II and native G4 in the genome. (A,B) Pol II subunit POLR2A ChIP-Rx and G4-CUT&Tag analyses showed that flavopiridol treatment resulted in increased Pol II occupancy and slightly increased G4 signals as seen at the promoter-proximal regions of NPM1 and SRSF4 (A) or around TSSs (B) by heat map analysis. (C,D) Metaplot analysis of G4 and POLR2A peak regions at active (C) and poised enhancers (D). (E,F) Immunostaining of G4 using BG4-EGFP (green) in HeLa cells treated with DMSO or TMPyP4 for 1 h. The nuclei were stained with DAPI (blue) (E). For each sample, images of 4–6 fields of vision were acquired with fixed parameters. Fifty-one nuclei in each sample were randomly selected, and the mean fluorescence intensities of G4s in each nuclear area were calculated by dividing the total intensities of BG4-EGFP with the nuclear area marked by DAPI (F). (G–I) Analysis of G4-CUT&Tag signals and ChIP-Rx signals detected by the Pol II subunits POLR2A and POLR2B antibodies as well as the NELF subunit NELFB antibody in HEK293T cells with or without TMPyP4 treatment. As shown at NPM1 loci (G) or heat map (H) and metagene plots (I) at gene coding regions, TMPyP4 treatment induced a global increase of G4 signals and decrease of Pol II and NELF occupancy around TSSs.


