
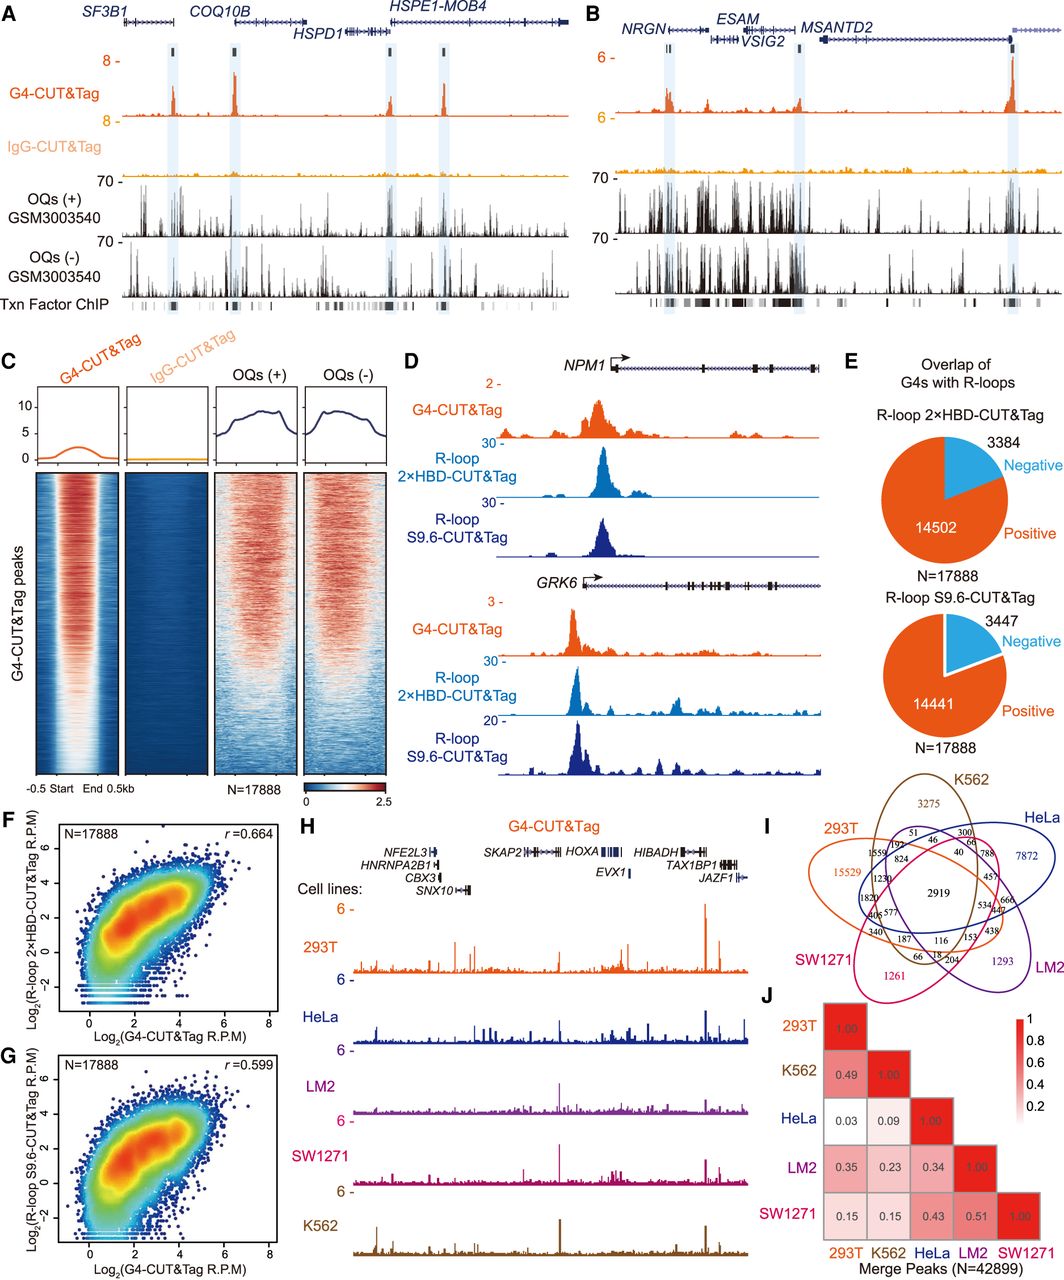
Characterization of native G4 signals in G4-CUT&Tag and their cell type specificity. (A,B) Genome browser tracks of G4-CUT&Tag and G4-seq in HEK293T cells. Observed G4 sequences (OQs) detected by G4-seq (GSM3003540) on the forward (+) and reverse (−) strands (Marsico et al. 2019) were compared with G4-CUT&Tag signals. Txn Factor ChIP track was derived from combining ChIP-seq peaks of 161 transcription factors in 91 cell types performed by the ENCODE Project. (C) Heat map and metaplot analyses of G4-CUT&Tag and G4-seq signals at G4 peaks. G4-CUT&Tag signals were positively correlated with OQs signals. Metaplots of these signals are shown at the top. (D) Track examples of G4-CUT&Tag, R-loop 2 × HBD-CUT&Tag, and R-loop S9.6-CUT&Tag signals at the NPM1 and GRK6 loci. (E) Pie graphs showing the overlap of G4-CUT&Tag peaks with R-loop signals identified by R-loop CUT&Tag with the DNA:RNA hybrid sensor 2 × HBD and S9.6 monoclonal antibody, respectively (Wang et al. 2021b). (F,G) Pearson's correlation of G4-CUT&Tag signals with R-loop 2 × HBD-CUT&Tag signals (F) and R-loop S9.6-CUT&Tag signals (G) at the 17,888 G4 peaks. (H) A snapshot from the UCSC Genome Browser showing G4-CUT&Tag signals in HEK293T, K562, HeLa, SW1271, and MBD-231-LM2 (LM2) cells. (I) G4 peaks were called with the corresponding whole-genome sequencing data of each cell line (SRX5466670, SRX3358201, SRX5449793, SRX6858029, and ERX4517391). Overlapping of these G4 peaks showed heterogeneity of G4s among different cell lines. (J) Correlation analysis of log2 fold change of G4 signals versus input in HEK293T, K562, HeLa, SW1271, and LM2 cells, showing the intercellular heterogeneity of G4s.


