
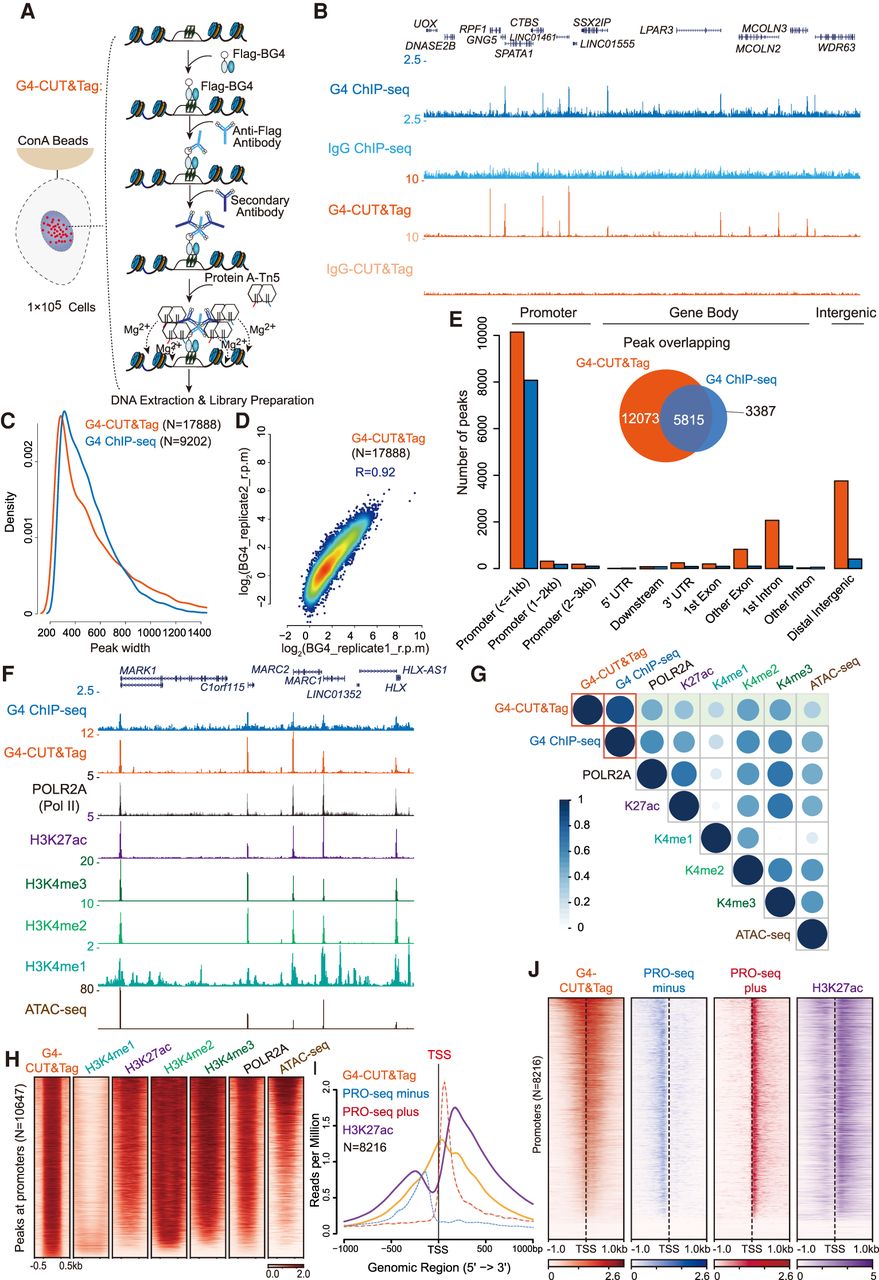
Comprehensive profiling of genome-wide native G4s by G4-CUT&Tag. (A) Schematic of G4-CUT&Tag with a G4-structure-specific single-chain antibody Flag-BG4. After binding of concanavalin A-coated magnetic beads to the cells and cell permeabilization, G4 structures were recognized by Flag-BG4 in situ. Anti-Flag antibody and secondary antibody were added sequentially to tether protein A-Tn5 transposase. Tn5 was activated by magnesium to cut the chromatin close to Flag-BG4 binding sites and simultaneously integrate adapters. After extraction, the Tn5-tagmented genomic DNA was amplified for library preparation and second-generation sequencing. For IgG control, mouse IgG was used to replace Flag-BG4 antibody. (B) UCSC Genome Browser tracks of G4 ChIP-seq and G4-CUT&Tag in HEK293T. The reads were aligned to human genome hg38 and normalized by reads per million. (C) Distributions of peak width of G4-CUT&Tag and G4 ChIP-seq. G4-CUT&Tag and G4 ChIP-seq peaks were called by MACS2 using corresponding IgG controls. A total of 17,888 G4-CUT&Tag peaks and 9202 G4 ChIP-seq peaks were identified. (D) Correlation plot between two G4-CUT&Tag biological replicates in HEK293T cells. (E) Genome-wide annotation of HEK293T G4-CUT&Tag and G4 ChIP-seq peaks. G4-CUT&Tag detected more G4s at the promoter, gene body, and intergenic regions than the G4 ChIP-seq method. (F) Tracks example of G4 ChIP-seq, G4-CUT&Tag, Pol II (subunit: POLR2A), H3K27ac, H3K4me3, H3K4me2, H3K4me1 ChIP-seq, and chromatin accessibility (ATAC-seq) in HEK293T, showing G4s mark transcriptional regulatory elements enriched with Pol II, multiple active chromatin marks, and open chromatin. (G) Correlation plot of G4s with POLR2A, histone modifications, and chromatin accessibility. Signals at the 17,888 G4-CUT&Tag peaks were counted and calculated by Pearson's correlation. (H) Heat map analysis of G4, histone modifications, POLR2A occupancy, and ATAC-seq signals at promoter regions in HEK293T. Heat maps were sorted by decreasing intensity of G4-CUT&Tag signals. (I,J) Metaplot and heat map of G4-CUT&Tag, PRO-seq, and H3K27ac signals at promoter regions. The TSSs are denoted by the vertical black-dashed lines.


