
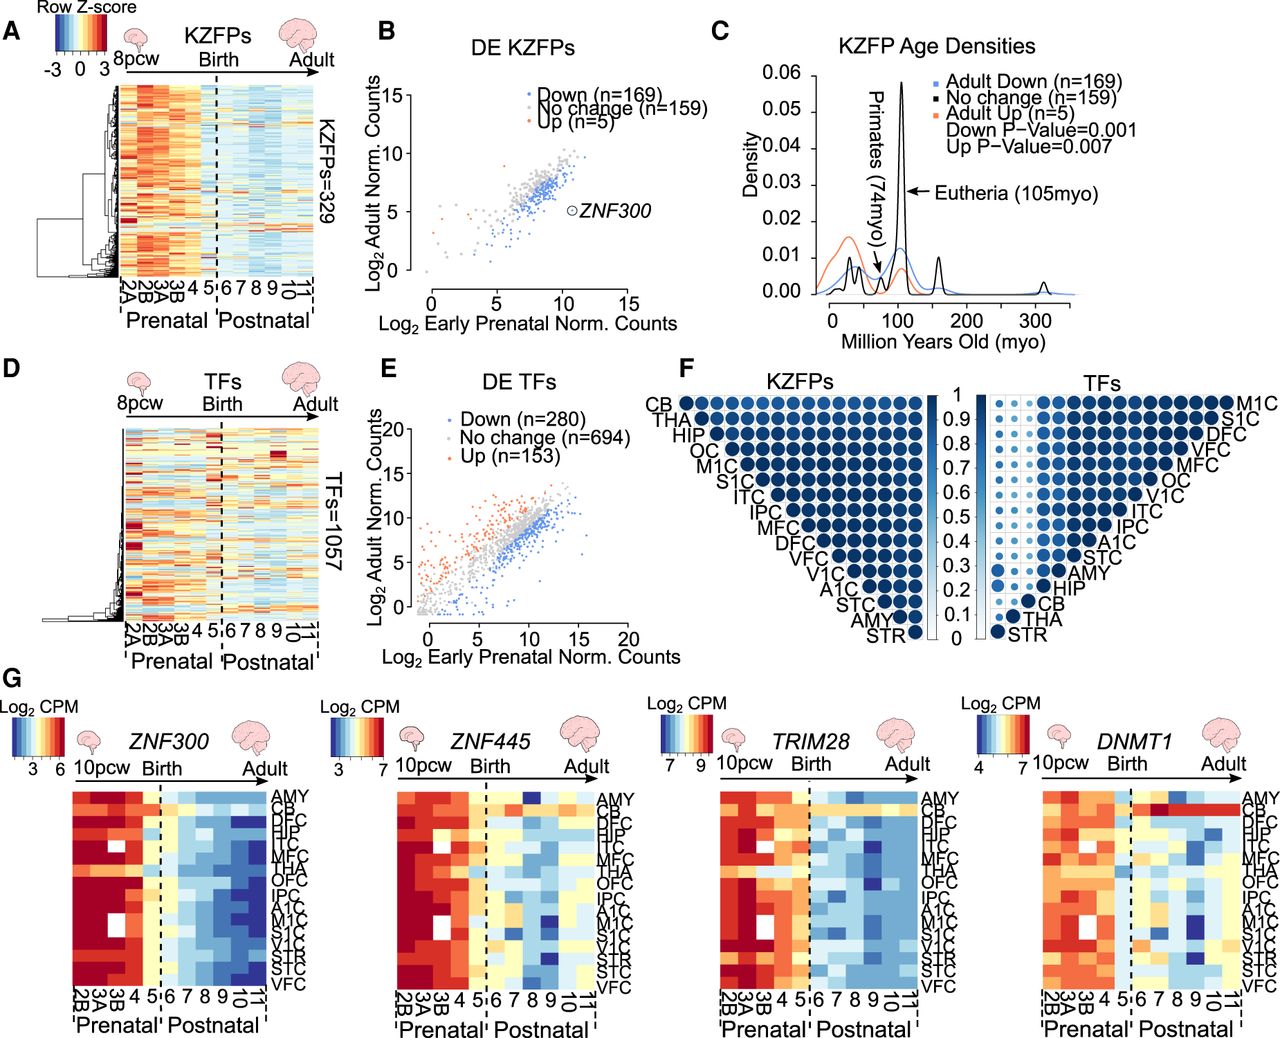
KZFP genes show a global pre- to postnatal decrease in expression. (A) Heatmaps of KZFP expression across human neurogenesis in the DFC. Scale represents the row Z-score. See also Supplemental Table S2. (B) Dot plot of differential expression analysis of KZFP genes in the DFC comparing adult (stage 11) to early prenatal stages (stage 2A–3B) of neurogenesis. Only KZFPs differentially expressed in both data sets are shown. Up (orange) represents KZFPs significantly up-regulated in adult versus early prenatal (fold change ≥ 2, FDR ≤ 0.05). Down (blue) represents KZFPs significantly down-regulated in the adult (fold change ≤ –2, FDR ≤ 0.05). See also Supplemental Table S3. (C) Density plot depicting estimated age of KZFPs of each category in B (P ≤ 0.05, Wilcoxon test). (D) Heatmaps of TF expression across human neurogenesis in the DFC. Scale same as in A. (E) Dot plot of differential expression analysis of TFs (as defined by Lambert et al. 2018) in the DFC, excluding KZFP genes, comparing adult (stage 11) to early prenatal stages (stage 2A to 3B) of neurogenesis. Only TFs differentially expressed in both data sets are shown. Up (orange) represents TFs significantly up-regulated in the adult versus early prenatal (fold change ≥ 2, FDR ≤ 0.05). Down (blue) represents KZFPs significantly down-regulated in the adult (fold change ≤ –2, FDR ≤ 0.05). See also Supplemental Table S3. (F) Correlation plots representing the Pearson correlation coefficient of temporal KZFP expression (left) and TF expression (right) between all 16 regions. Size of spot and color both represent the correlation coefficient. (0) No correlation, (1) strong correlation. (G) Heatmaps depicting the log2 counts per million (CPM) for selected KZFPs and TFs over the 16 regions included. See also Supplemental Tables S1 and S2. All plots show expression data from BrainSpan.


