
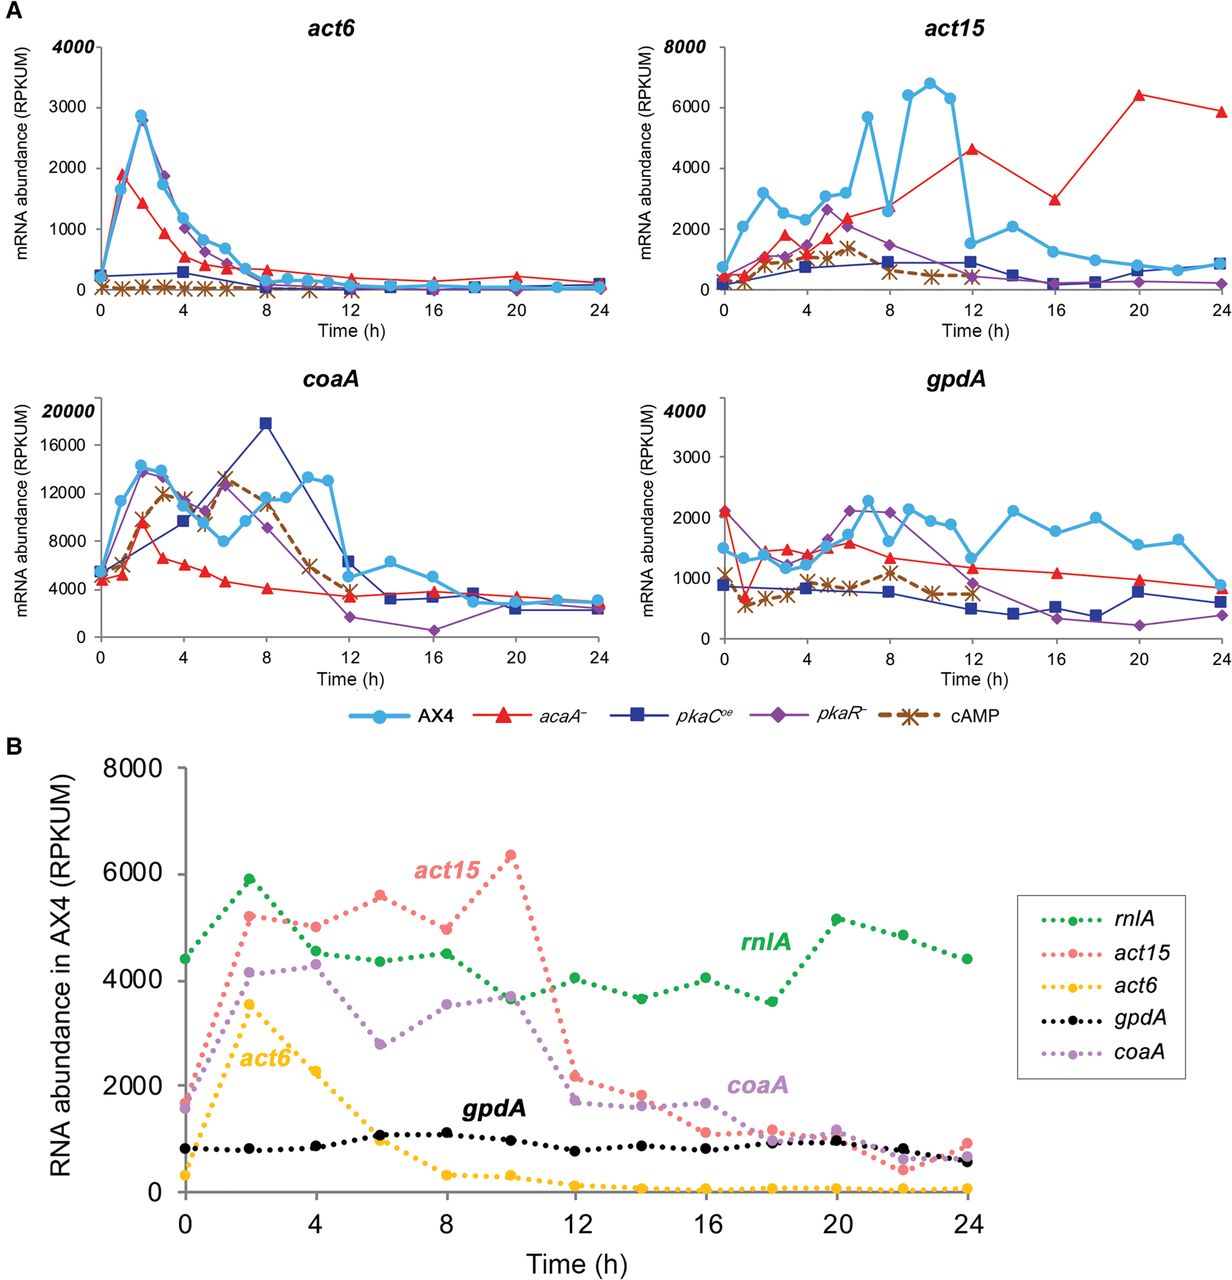
The expression patterns of common genetic markers. The mRNA abundance trajectories of the genes act6, act15, coaA, and gpdA (y-axis, RPKUM) are plotted against developmental time (x-axis, hours). (A) Data are from our data set (normal filter development) for strains AX4, acaA−, pkaCoe, and pkaR− and from AX4 cells developed in suspension with cAMP pulses (Rosengarten et al. 2015). The gene names are indicated above each panel, and the strains/conditions are indicated below the panels (cAMP: cells pulsed with cAMP in suspension). Note that the y-axes are different between the panels. (B) Data are from AX4-development RNA samples that were enriched by ribosomal RNA depletion (Rosengarten et al. 2017). Gene names are shown on the right.


