
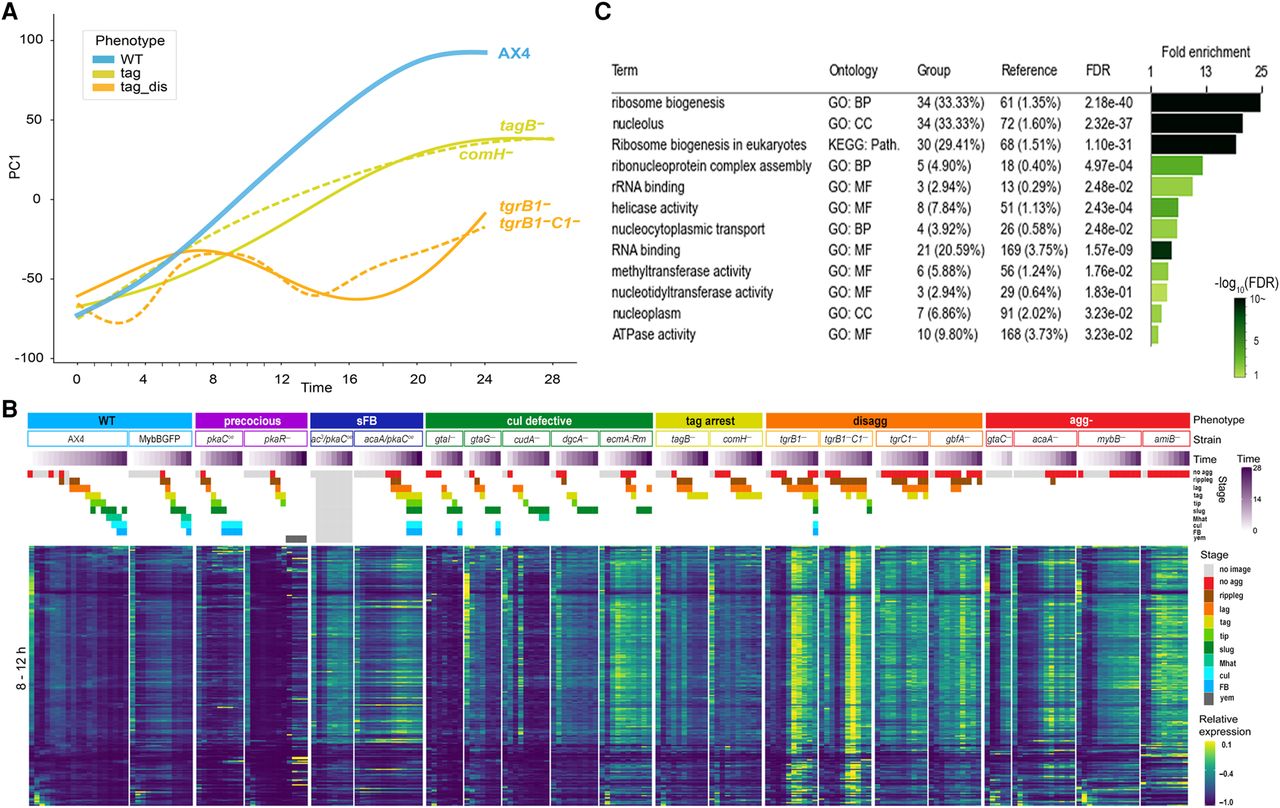
Transcriptome changes during disaggregation. (A) We plotted PC1, which explains 30.4% of the variance, (y-axis, arbitrary units) against time (x-axis, hours) of the disaggregation strains (tag_dis, light orange), tag arrested strains (tag, dark yellow), and AX4 (WT, light blue). The graphs are a subset of Figure 2. (B) Up-regulated genes in both tgrB1− and tgrB1−C1− but not in comH−, tagB−, and AX4 were selected by differential expression analysis of the 8- to 12-h samples. The changes of mRNA abundance of these genes are shown as heatmaps in all 21 strains. Phenotype groups, strain names, developmental time (purple gradation, see scale on the right) and morphological stages (see color legend on the right) are indicated above the heatmaps. The phenotype groups are WT (light blue), precocious development (precocious, violet), small fruiting body (sFB, dark blue), culmination defective (cul defective, dark green), tight-aggregate arrest (tag, dark yellow), tight-aggregate/loose-aggregate disaggregation (disagg, orange), and aggregationless (agg-, red). The morphological stages are no aggregation (no agg, red), rippling/stream (ripple, brown), loose aggregate (lag, orange), tight aggregate (tag, dark yellow), tipped aggregate (tip, light green), slug/first finger (slug, dark green), Mexican hat (Mhat, jade green), culmination (cul, cyan), fruiting body (FB, light blue) and yellow mound (yem, dark gray). (C) The table shows gene-set enrichments among the up-regulated genes. The bar size shows the fold enrichment and the color (see scale) represents the false discovery rate, (FDR; hypergeometric test). GO: Biological process (BP), cellular component (CC), molecular function (MF), KEGG: pathway (Path.)


