
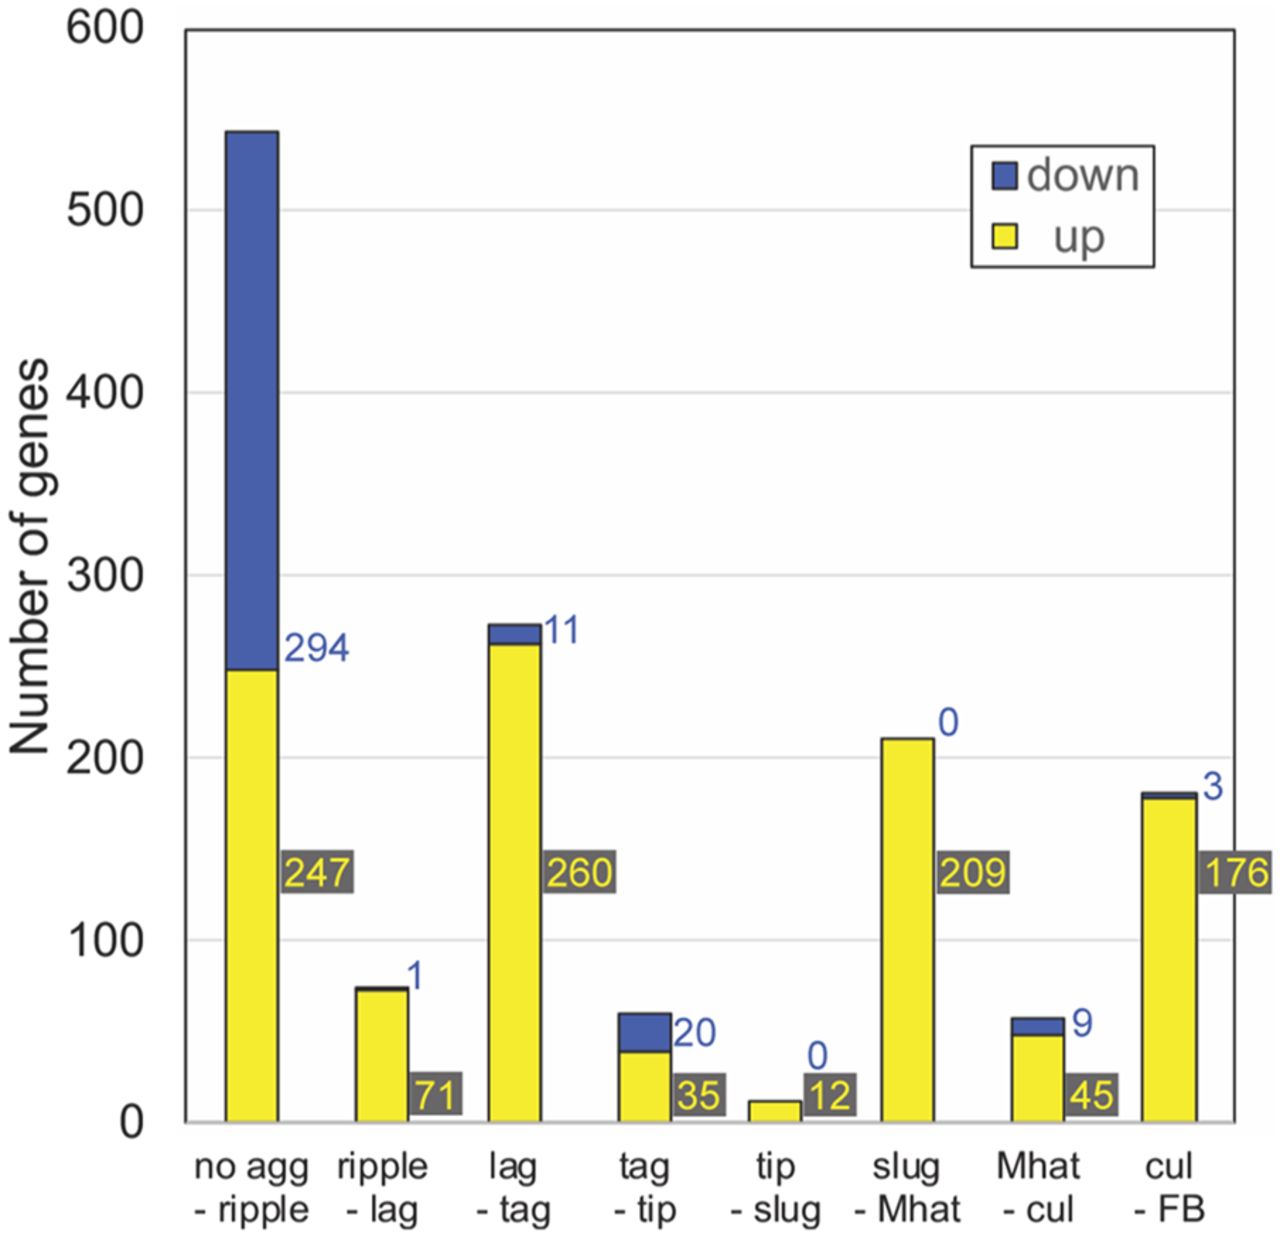
The number of milestone genes at each developmental transition. We performed differential expression analysis between samples across each developmental transition in AX4 (WT) development and selected transcripts that showed significant change at each transition. The graph shows the number of differentially expressed genes at each stage transition in AX4 (WT). Down-regulated genes (blue): mRNA abundance at the early stage is significantly greater than mRNA abundance at the later stage. Up-regulated genes (yellow): mRNA abundance at the early stage is significantly lower than mRNA abundance at the later stage. The stage transitions are indicated below each bar. Colored numbers beside the bars indicate the number of genes in each “down” and “up” category.


