
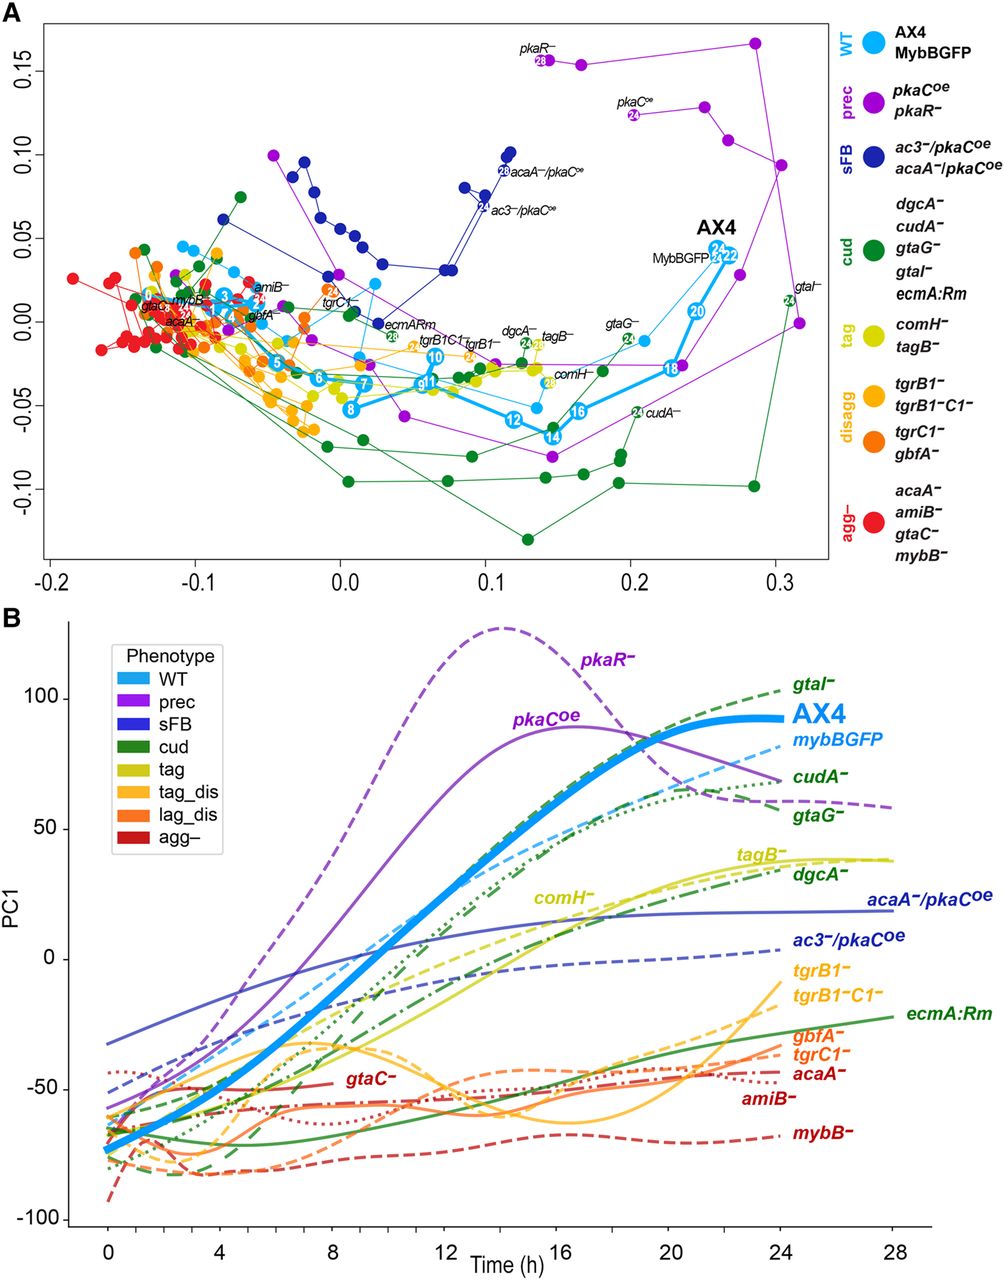
Characteristic transcriptome patterns of different phenotype groups. We analyzed the transcriptomes of the developing cells across time by RNA-seq and used dimensionality reduction techniques to compare the different strains. (A) In the MDS plot, each circle represents the average transcriptome of 2–7 replicates at a certain time point of a strain. The arbitrary units of the x- and y-axes reflect the distances between the transcriptomes such that the proximity between the circles approximates their similarity (adjacent circles are similar to one another). The circle and line colors represent the phenotype group of the strain, and the strain name is indicated next to the last time point, which is indicated inside the circle (hours). The circles are connected in temporal order. The phenotype groups are WT (light blue), precocious development (prec, violet), small fruiting body (sFB, dark blue), culmination defective (cud, dark green), tight-aggregate arrest (tag, dark yellow), tight-aggregate/loose-aggregate disaggregation (disagg, light and dark orange, respectively), and aggregationless (agg-, red). The strain names in each phenotype group are indicated next to the terminal time point. Developmental time points are indicated in each of the AX4 circles and in the last time point of each strain. (B) We performed PCA and plotted PC1 (y-axis, arbitrary units) against time (x-axis, hours) of each strain. PC1 accounts for 30.4% of the variation. The strain names are indicated in the plot, and the color represents the phenotype group (see legend). The wild type (AX4) is shown as a thick line and bold text.


