
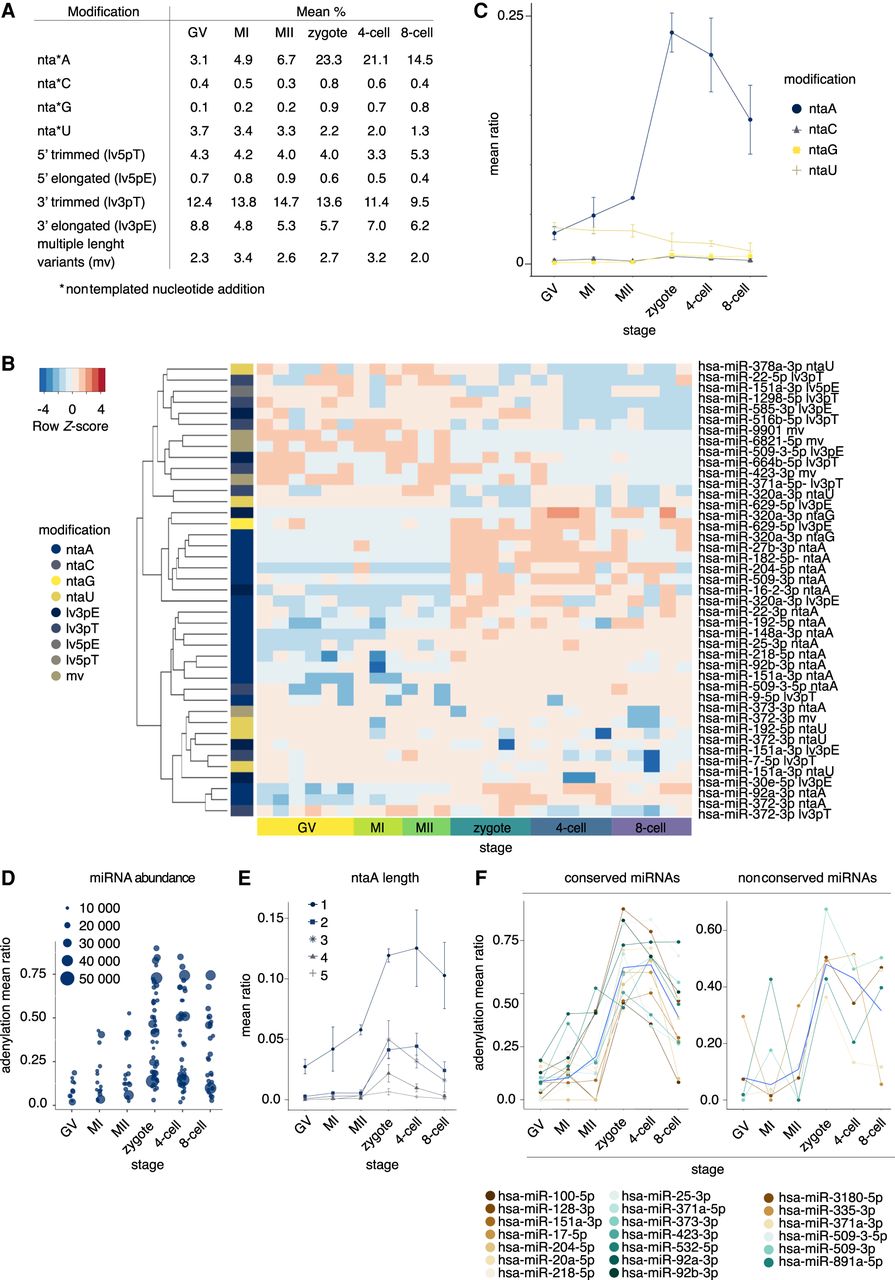
Dynamic miRNA 3′ tailing in human oocytes and early embryos. (A) miRNA modification mean proportions in different developmental stages. (B) Heatmap of DE (FDR < 0.05) miRNA modification isoforms (isomiRs) according to MACAU 2.0 (Sun et al. 2017). Euclidean distance and average linkage were used to cluster isomiRs (see A for nomenclature) by expression, presented as row Z-scores. (C) miRNA 3′ nontemplated nucleotide addition of A, C, G, and U in different developmental stages. miRNA 3′ adenylation (A-tailing) is frequent in zygotes and early embryos. (D) miRNA A-tailing ratio of 50 miRNA species (mean normalized reads greater than 500 in at least one stage). Size of the circle indicates the stagewise mean of the normalized miRNA abundance. (E) miRNA A-tailing modification length in different developmental stages. Modification lengths of up to 5 nt are shown. Addition of a single nucleotide was the predominant modification. (F) A-tailing dynamics of conserved and nonconserved miRNAs with highest A-tailing ratios (mean normalized reads greater than 1000 and mean ratio above 0.33 in at least one stage). Locally estimated scatterplot smoothing (loess) curve (blue) resembled the overall A-tailing modification trend. Mean stagewise miRNA modification ratio (C–F) and the 95% confidence interval (C,E,F) are shown.


