
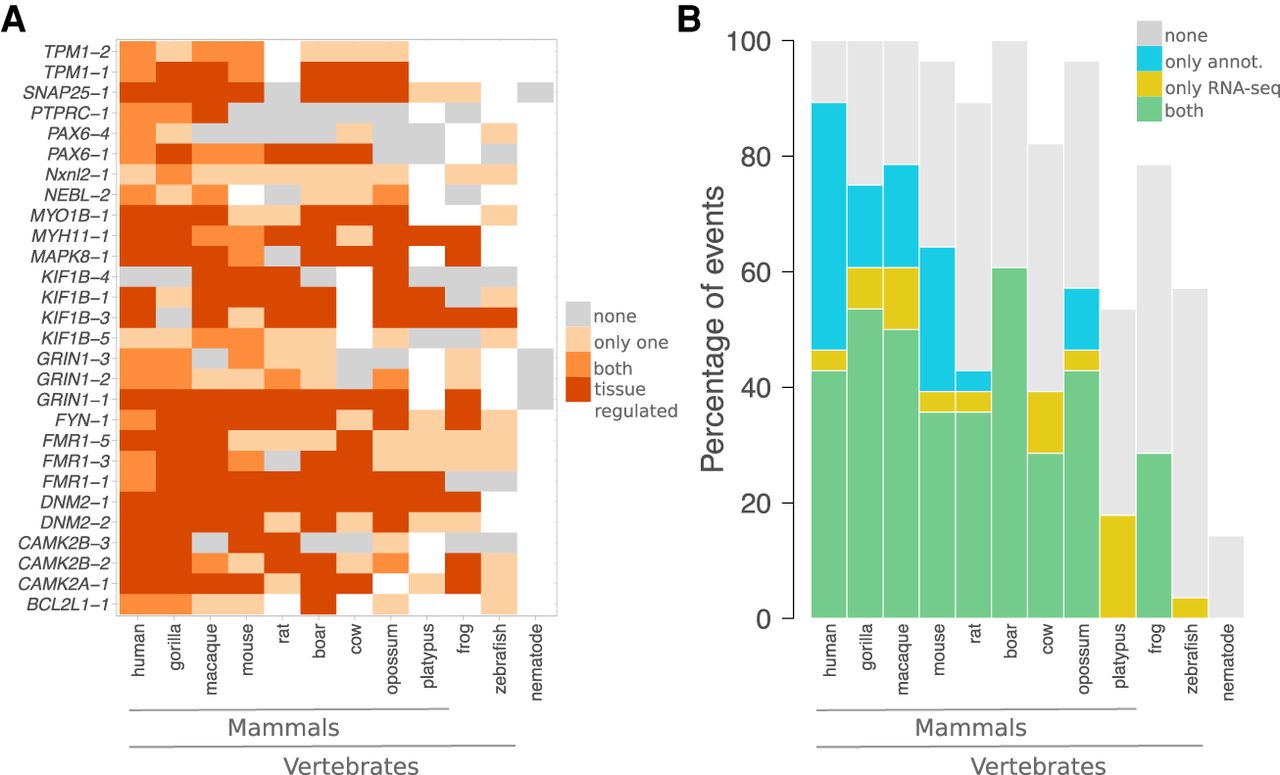
Conservation and tissue regulation of a set of documented AS events. (A) Each event is designated by the name of the gene where it occurs and its rank in ThorAxe output, the latter reflecting its relative conservation level. In the ESG, an event corresponds to a pair of subpaths, one being canonical and the other alternative. Within each species, either none of the paths are supported by the data (gray), or only one path is supported (light orange), or both paths are supported (orange and dark orange). As data, we consider the gene annotations from Ensembl and the RNA-seq evidence compiled from public databases. When both paths are supported, we highlight the cases in which they are differentially expressed in at least one tissue in dark orange. The white cells indicate species in which a one-to-one ortholog of the human query gene could not be found. (B) For each species, the percentages of events supported by both gene annotations and RNA-seq (in green), by only RNA-seq (in yellow), by only gene annotations (in blue), or unsupported (in gray) are reported. An event is considered to be supported only if both its canonical and alternative subpaths are detected.


