
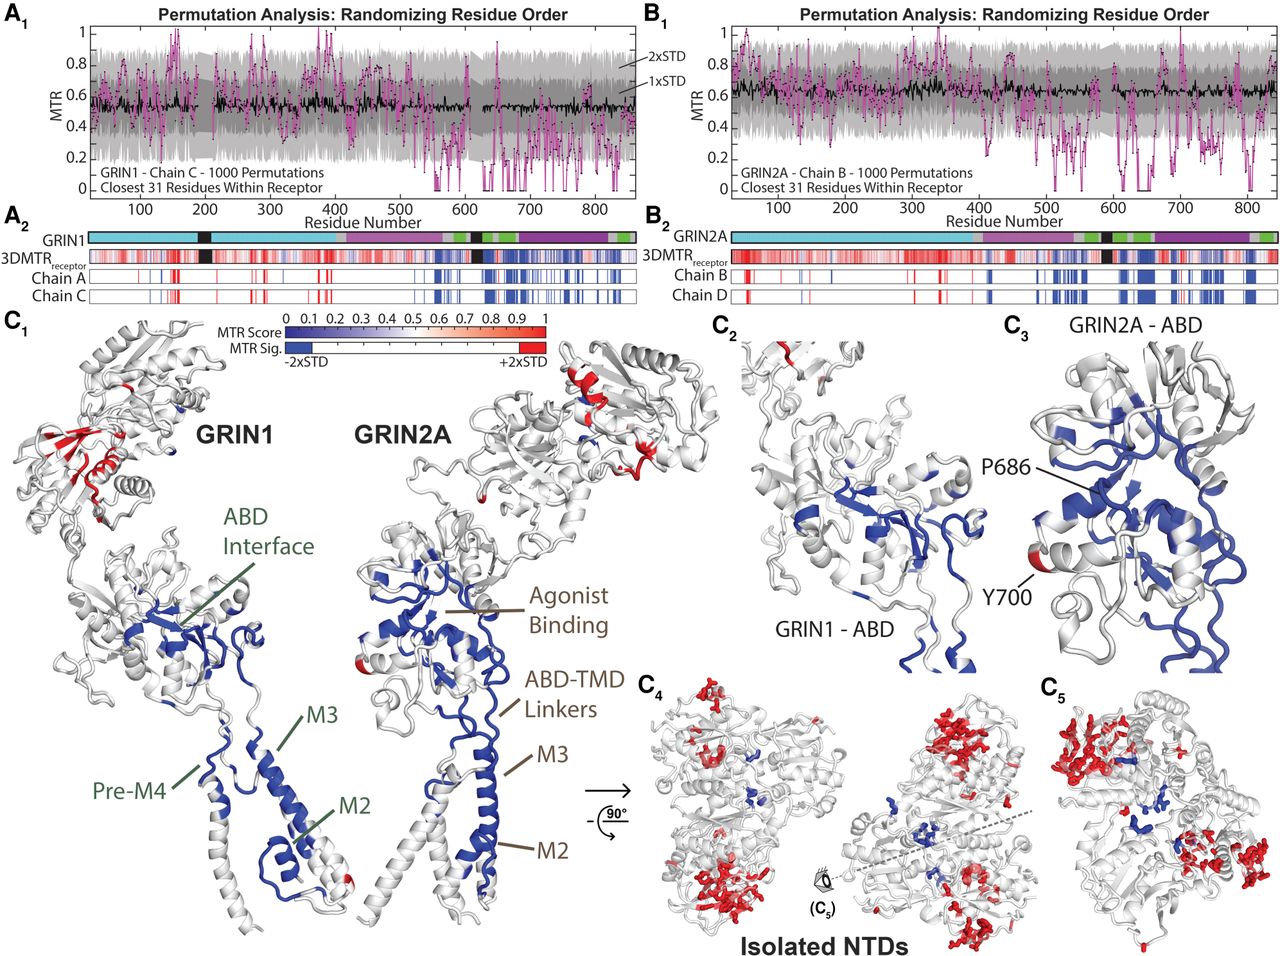
Permutation analysis (residue randomization) identifies the 3DMTR scores that are unlikely given random chance. (A1) Scatter plot of the GRIN1 (Chain C) 3DMTR score (magenta line, black dots), the permutation 3DMTR score mean (black line), and ±1 and ±2 standard deviations of the permutation 3DMTR score (gray areas). The mean and standard deviation are calculated for each residue based on the permutation results for that particular residue (for the distributions of several example data sets, see Supplemental Fig. S10). (A2) Raster plots of the GRIN1 3DMTR score and the calculated significance via permutation analysis. A residue is deemed highly intolerant (blue, less than the permutation analysis mean minus 2 standard deviations) and highly tolerant (red, more than the permutation analysis mean plus 2 standard deviations). (B) Permutation analysis for GRIN2A (Chain B) as shown by similar plots in A. (C) The structural map of calculated significance from permutation analysis (same as the raster plots above), mapped onto a GRIN1 subunit and GRIN2A subunit (C1). Closer view of the ABDs: (C2) GRIN1; (C3) GRIN2A. Closer view of the NTDs, shown with side chains (sticks) of the identified significant residues: (C4) top down; (C5) side view depicted in C4.


