
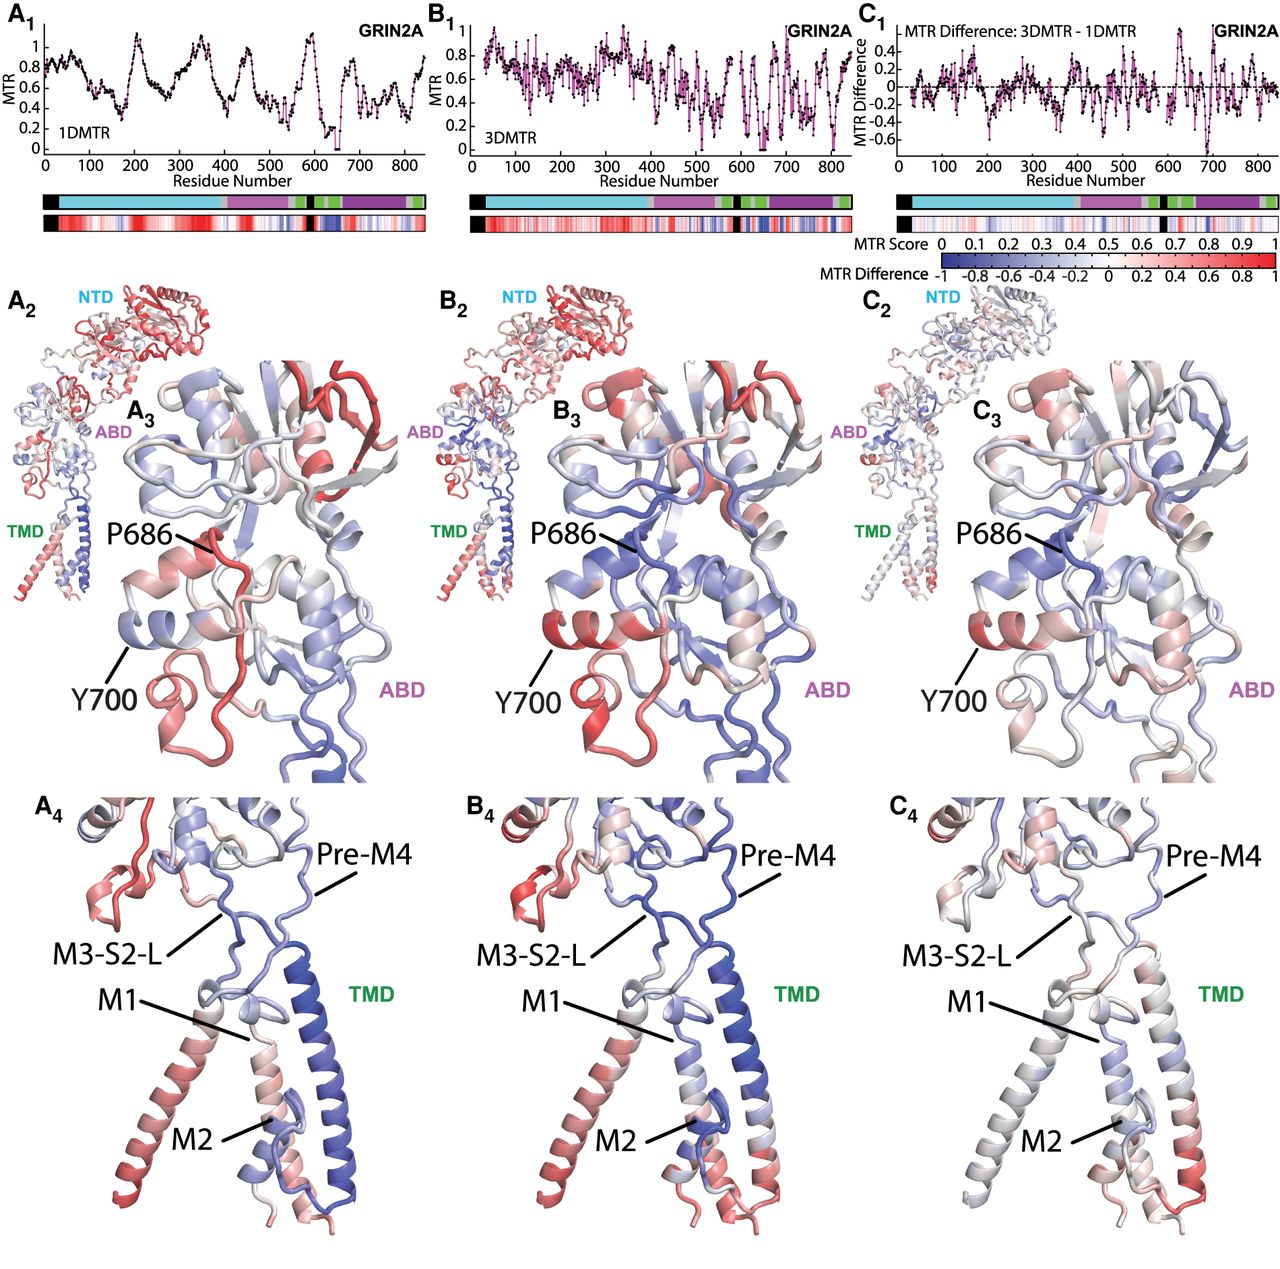
Figure 3.
Comparison of the GRIN2A 1DMTR and 3DMTR intra-subunit scores. (A) The linear (1D) MTR score of GRIN2A. (A1) The 1DMTR score shown via a scatter plot and raster plot (see color bar for score representation; intolerant scores are blue, tolerant scores are red). (A2) View of the 1DMTR score heatmap applied to the GRIN2A structure. (A3) A closer view of the ABD in A2. (A4) A closer view of the TMD in A2. (B) The 3DMTR score of GRIN2A, illustrated similarly as in A. (C) The difference in the 3DMTR and the 1DMTR score of GRIN2A. The color bar for the raster plots and the structure heatmaps is shown above C2.


