
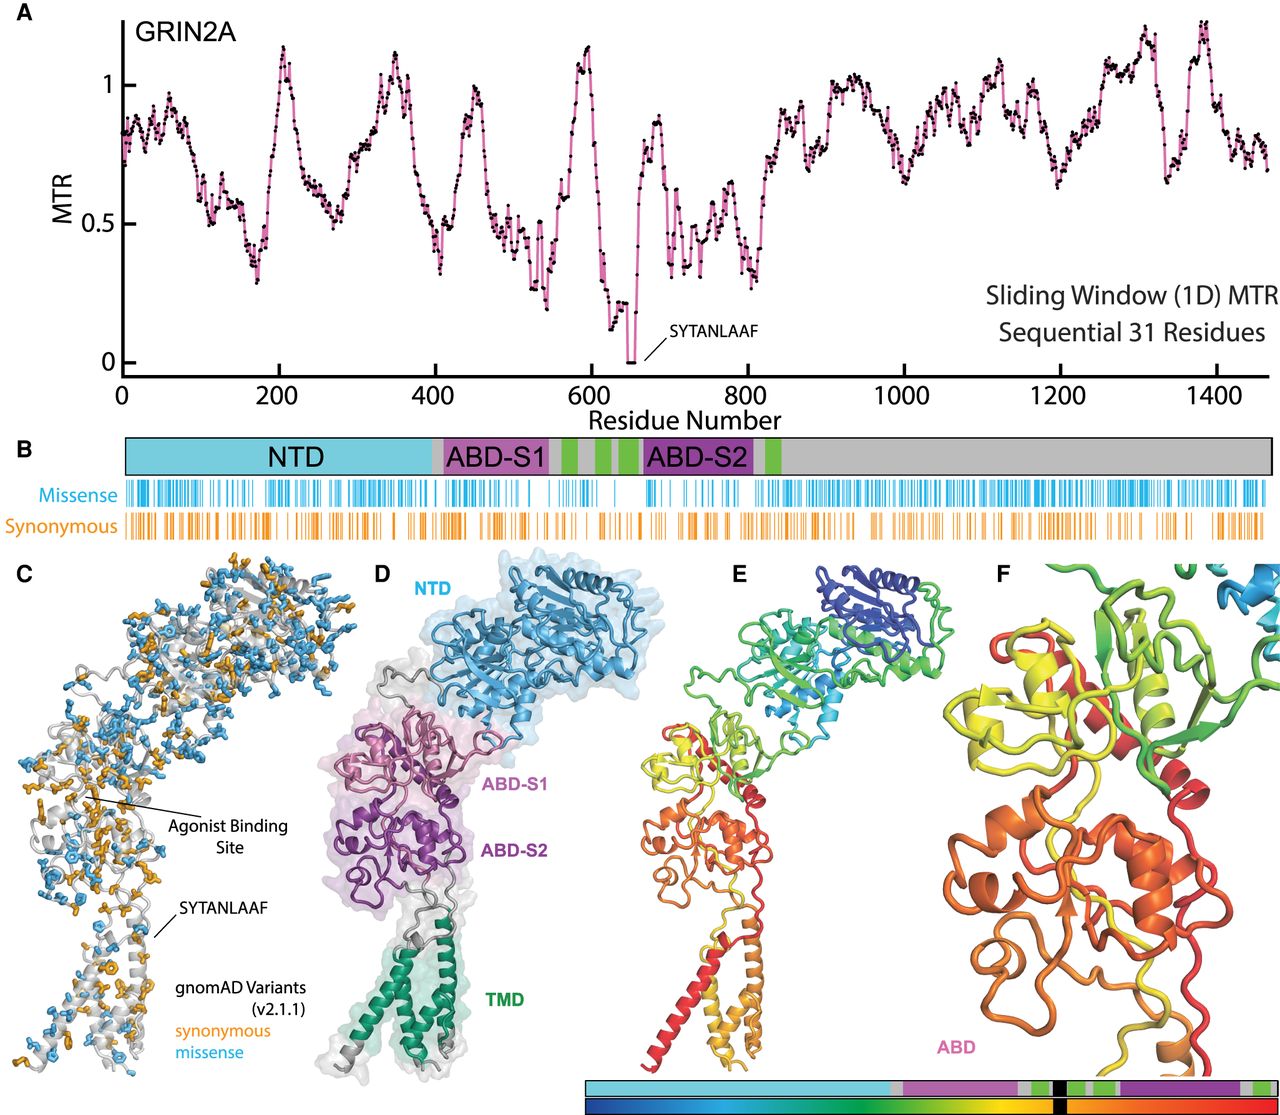
The sequential MTR score (1DMTR) of GRIN2A and structural mapping of GRIN2A variants. (A) The 1DMTR score of GRIN2A, calculated using gnomAD v2.1.1. (B) Linear domain map of the GRIN2A gene semiautonomous domains of the receptor. The linear map matches the x-axis of the graph in A. A raster plot of the GRIN2A variants found in gnomAD is plotted below the linear map: (orange) synonymous variants; (cyan) missense variants. (C) View of the GRIN2A structure (homology model) (Supplemental File 1) depicting the GRIN2A variants shown in B. (D) View of the GRIN2A subunit illustrating the extracellular and transmembrane domains. The NTD is depicted in cyan, the first ABD segment (ABD-S1) in magenta, the second ABD segment (ABD-S2) in purple, the TMD in green, and the linkers in gray. (E) View of the GRIN2A subunit colored to depict its position along the polypeptide chain, represented by the gradient shown below the structure. The gradient is shown next to the linear domain map depicting the main receptor domains. Some residues in the M1-M2 linker are missing from the structure, shown by the black region in the linear scale. (F) A closer view of the GRIN2A ABD highlighting the two portions of the polypeptide chain (ABD-S1, ABD-S2) that form the domain.


