
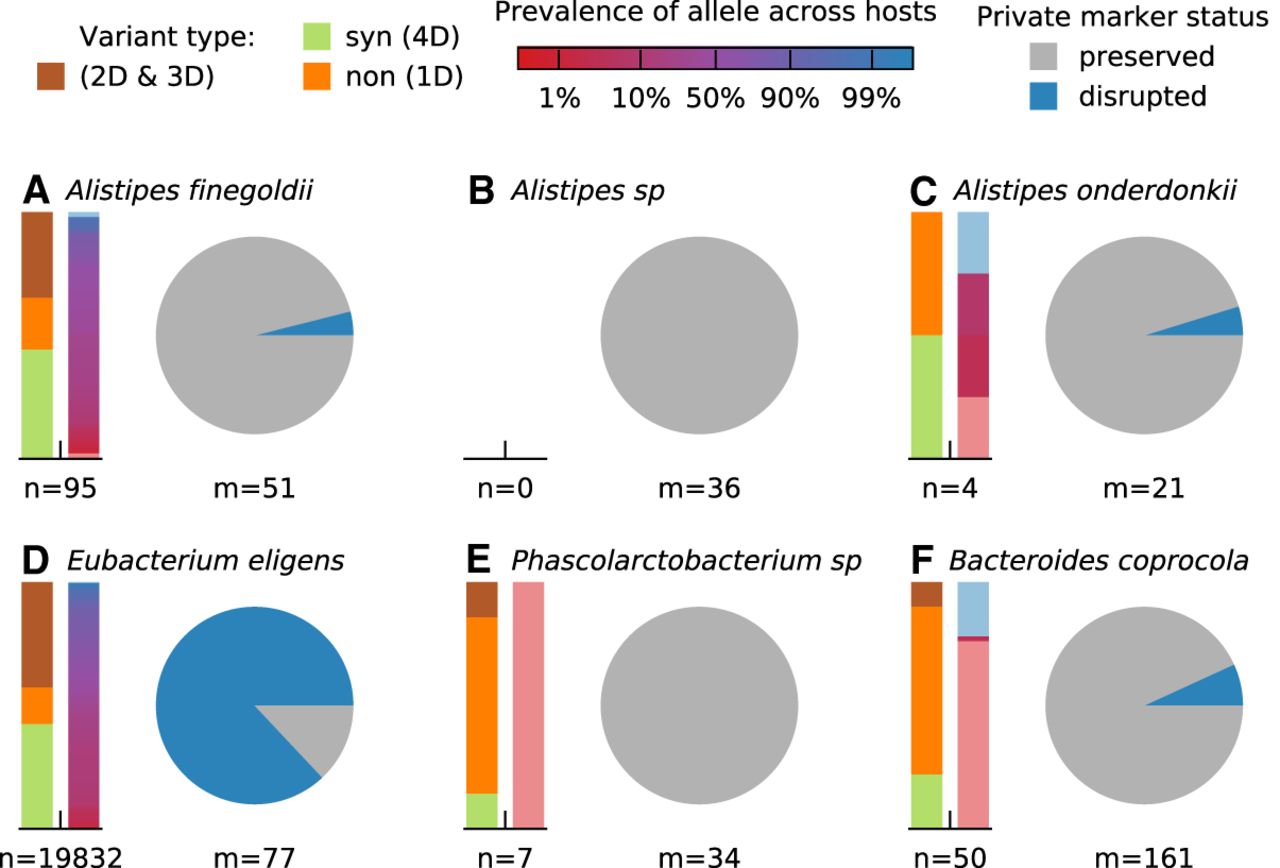
Signatures of strain replacement and evolutionary modification. (A–F) Statistical properties of temporally varying SNVs from the six example species in Figure 3. For each species, the bars on the left show the relative proportion of SNVs with different protein-coding effects and allele prevalence across other hosts in a larger cohort (Methods). Protein-coding effects are estimated from the codon degeneracy at each site (4D = fourfold degenerate/synonymous, 1D = onefold degenerate/nonsynonymous). Allele prevalences for SNVs not observed in other hosts are indicated by light red or blue shading. Pie charts indicate the relative proportion of private marker SNVs for each species that are preserved or disrupted throughout the sampling interval (Methods). Large fractions of disrupted marker SNVs indicate a strain replacement event.


