
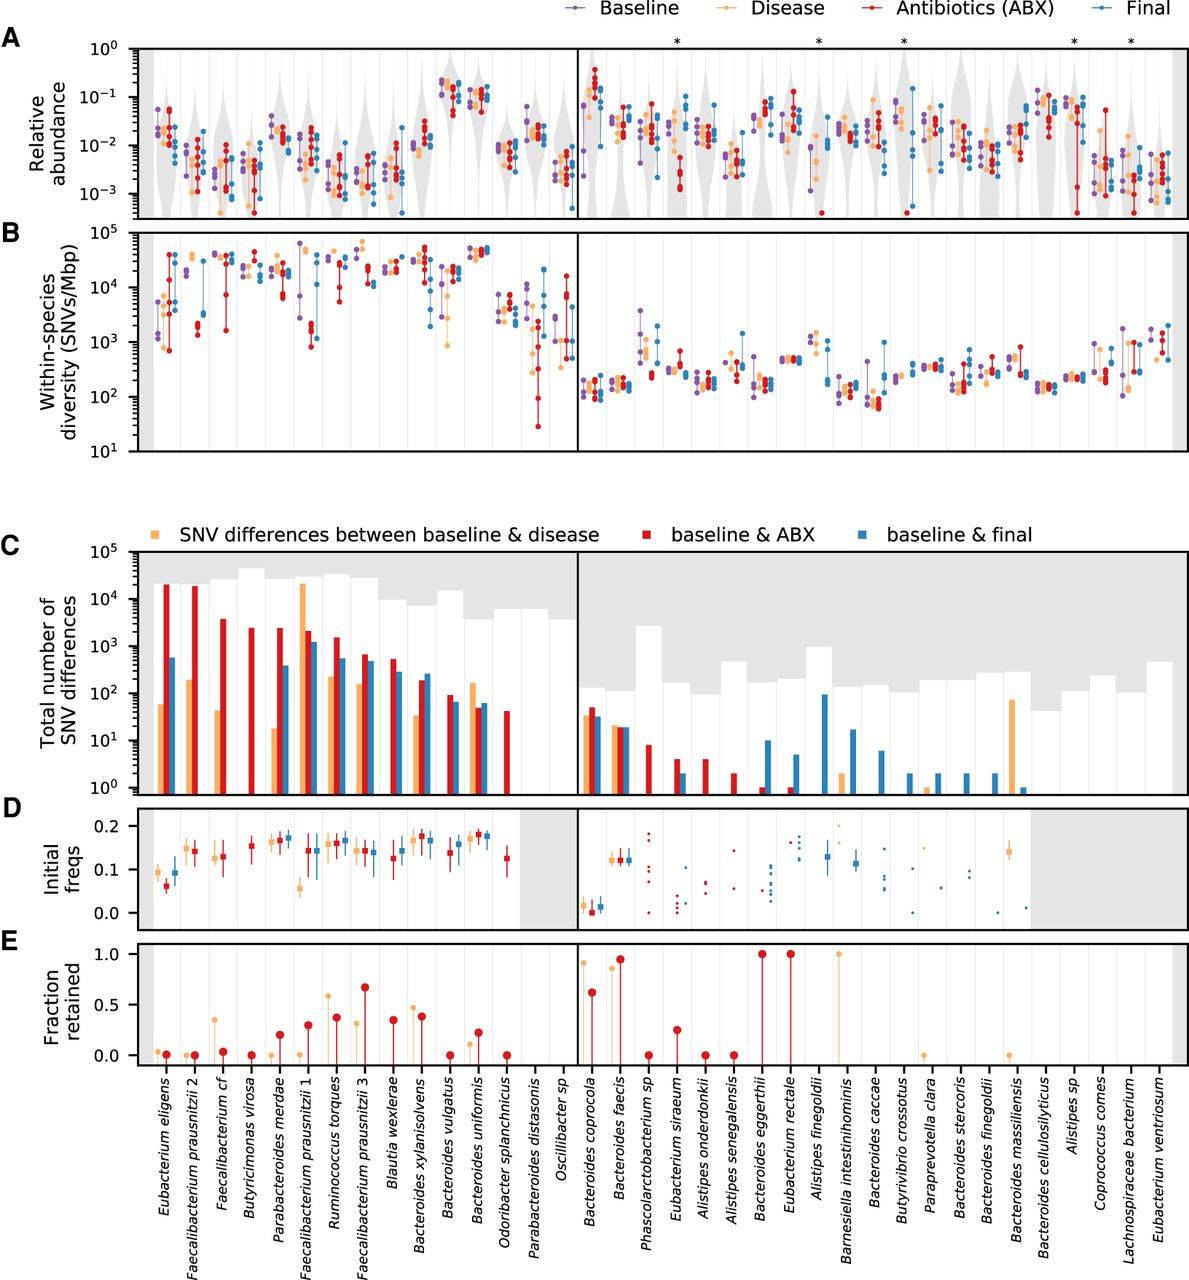
Varied ecological and genetic responses across 36 abundant species in the same host. (A) Relative abundances of species through time, partitioned according to the epochs defined in Figure 1A. Each time point is indicated by a point, and the time points from the same epoch are connected by a vertical line to aid in visualization. For comparison, the gray distribution shows the corresponding values across a larger human cohort (Methods). Species whose relative abundance drops by more than 10-fold between baseline and antibiotic time points are indicated with a single star. Only a minority of the most abundant species experience such reductions in relative abundance during treatment. (B) Within-species nucleotide diversity for each time point, as measured by the fraction of core genome sites with intermediate allele frequencies (0.2 < f< 0.8) (Methods). Points are plotted using the same color scheme as panel A. (C) The total number of single nucleotide (SNV) differences between a baseline time point and each of the later epochs (Methods). The height of the white area indicates the total number of polymorphic SNVs that were tested for temporal variation. Different species display a range of different behaviors, which can be partitioned into putative cases of competition between distantly related strains (left of vertical divider line) and evolution within a dominant resident strain (right). (D) Initial frequencies of alleles identified in panel C. For species with more than 10 SNV differences, the data are summarized by the median initial frequency (square symbol) and the interquartile range (line). Many alleles have nonzero frequency before the sweep occurs. (E) Fraction of SNV differences in panel C that are retained at the final time point (f > 0.7). In many species, only a minority of SNV differences gained during disease or treatment are retained.


