
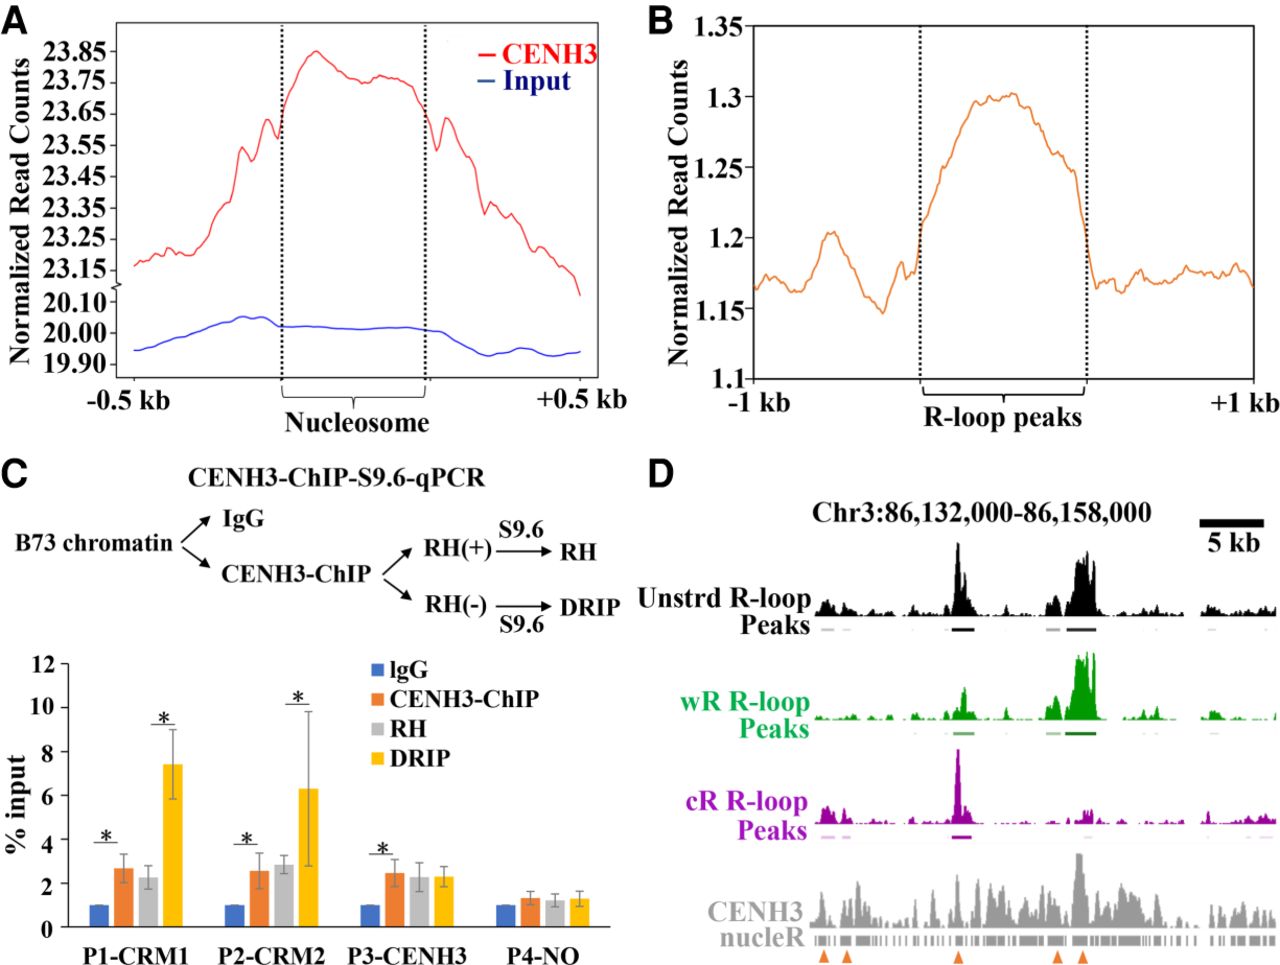
CENH3 binding regions are favorable for R-loop formation. (A) Metaplots of R-loop peaks along the CENH3 and input nucleosome and the up- and downstream regions. (B) Metaplots of CENH3-ChIP reads along the R-loop peaks and the up- and downstream regions. (C) Procedure of CENH3-ChIP-S9.6-qPCR (top). Data are means ± SE of three independent experiments. The values were compared by Student's t-test. (*) P-value < 0.05. (IgG) Immunoglobulin G. (D) A representative region showing CENH3-ChIP and R-loop data. Line 1, unstranded (unstrd) R-loops signal, normalized to the genome-wide mean; line 2, unstrd R-loop peaks; line 3, normalized wR-loops signal (green); line 4, wR-loop peaks; line 5, normalized cR-loop signal (purple); line 6, cR-loops peaks; line7, CENH3 ChIP-seq reads; line 8, CENH3 nucleosome positions identified by nucleR. The arrowheads indicate the colocalization regions of CENH3 nucleosomes and R-loops.


