
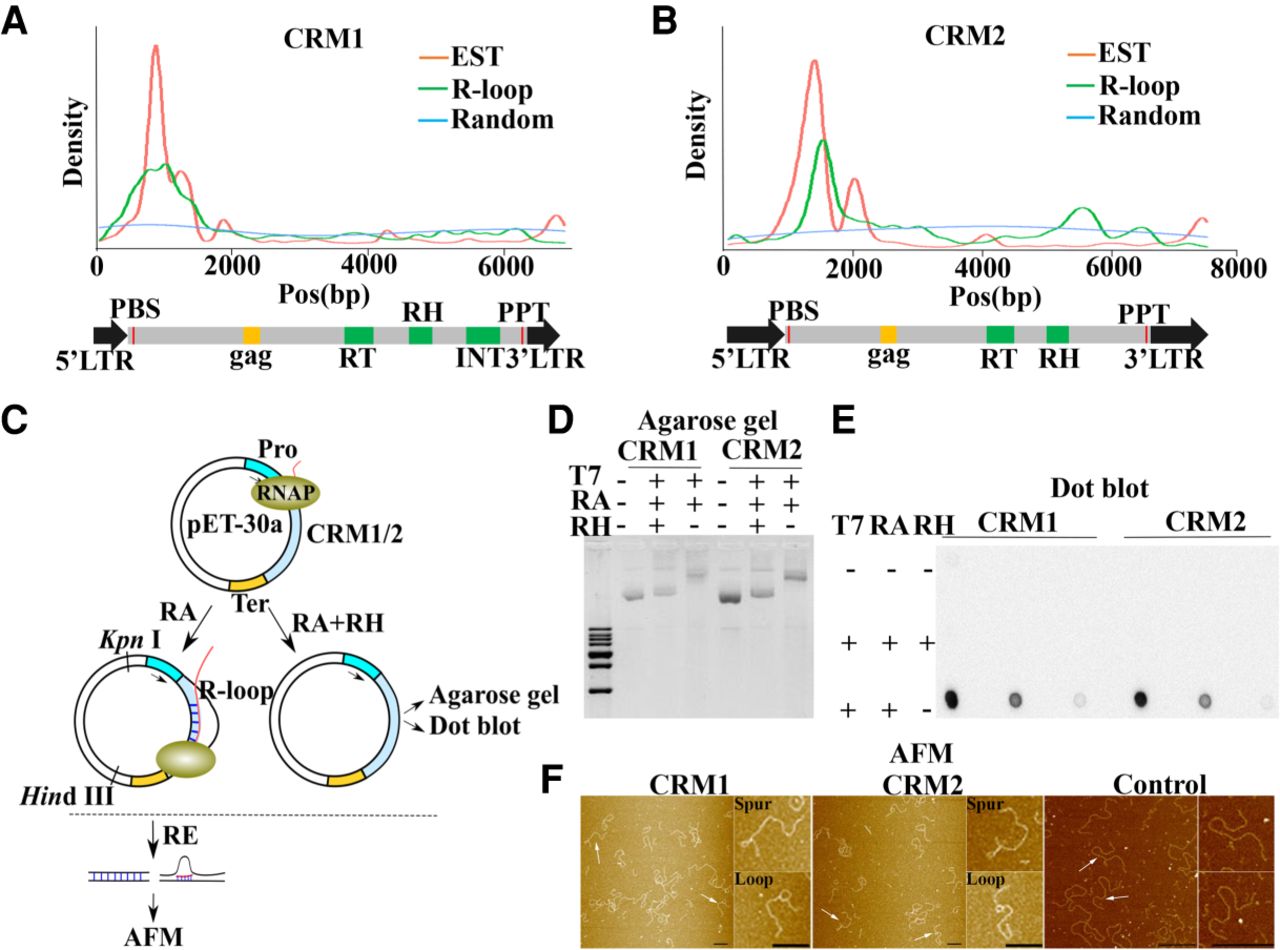
Contribution of CRM1 and CRM2 to R-loop formation in the maize centromere. (A,B) Distribution of R-loops and ESTs on CRM1 (A) and CRM2 (B). The blue line represents the distribution of 10,000 randomly selected 150-bp reads that were used as controls for comparison. The red and green lines represent the distribution of ESTs and R-loops, respectively. The entire CRM1 and CRM2 elements are shown below with domains highlighted. (RT) Reverse transcriptase, (RH) RNase H, (INT) integrase. (C) Diagram of the main steps of the in vitro transcription system. (RE) Restriction enzyme, (RH) RNase H, (RA) RNase A (Pro) promoter, (Ter) terminator, (RNAP) RNA polymerase II. (D,E) The circular plasmids pET-30a-CRM1/CRM2 were transcribed in vitro and treated or not with RNase H or RNase A as indicated. After purification, the DNA was run on agarose gels (D) or spotted on a membrane to perform dot blot analysis with the anti-S9.6 antibody (E). (F) pET-30a-CRM1/CRM2 and pET-30a-Control were processed as in Figure 4C and visualized using AFM. Magnifications of the molecules are identified by arrows. Scale bar = 200 nm.


