
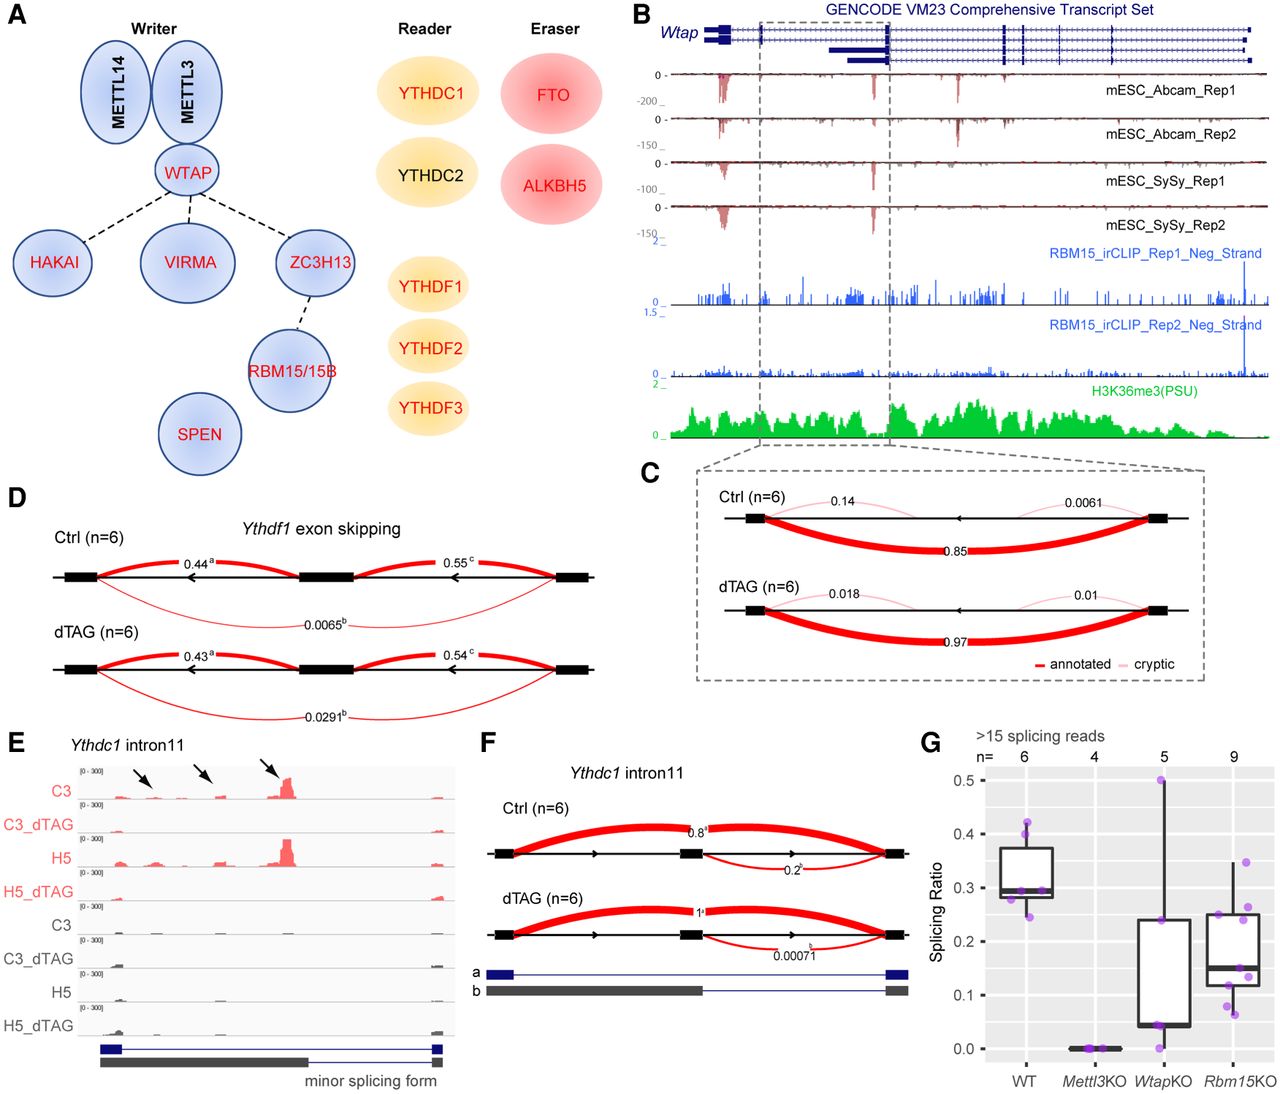
Splicing changes contribute to m6A self-regulation as an early consequence of acute m6A loss. (A) Schematic of m6A writer, reader, and eraser complexes. Genes containing m6A modification are indicated by red text. Dashed lines in the writer complex indicate biochemically uncharacterized interactions. (B,C) Genome Browser tracks (B) and Sashimi plot showing the detalPSI (C) for Wtap. Like the Tor1aip2 gene shown in Figure 6, the splicing is of type “pf_IR.” (D) Sashimi plot showing the deltaPSI calculated from LeafCutter for Ythdf1 gene, ES type. (E) IGV tracks showing MeRIP-seq signal (top four tracks) and input signal (bottom four tracks) for Ythdc1 intron11. Arrowheads indicate m6A peaks located in the alternative intron/exon part. Annotated splicing forms are shown below. (F) Sashimi plot showing changes for Ythdc1 intron11, which is of type “SAS.” (G) Box plots showing the splicing choice score for the minor splicing form of Ythdc1 intron11 from ChrRNA-seq data sets in which components of the m6A writer complex are perturbed (Nesterova et al. 2019). Samples were included only if more than 15 reads span the junction at Ythdc1 intron11.


