
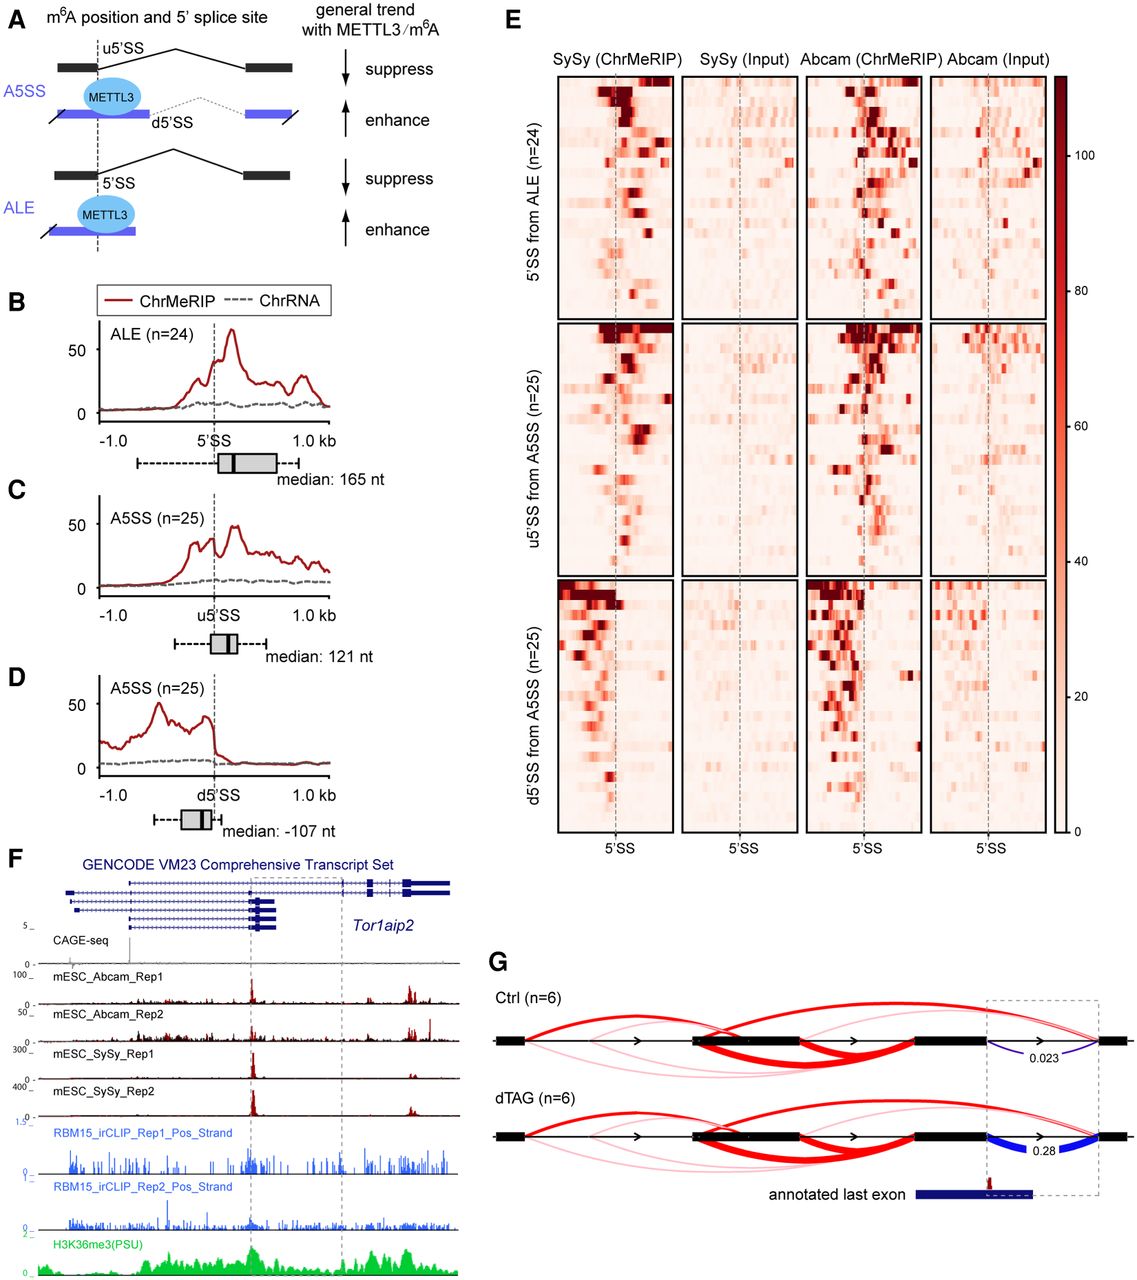
METTL3/m6A-mediated alternative intron/exon inclusion. (A) Schematic showing the general splicing output for splicing type A5SS and ALE with m6A modification. (B–D) Aggregate m6A signals over the 5′ splice sties (±1 kb) for ALE (n = 24) (B) and upstream (C) or downstream (D) 5′ splice site for A5SS (n = 25). Red solid and dashed gray lines indicate the ChrMeRIP and ChrRNA input samples, respectively. Box plots denote the distance distribution between the 5′SS and the closest m6A peak summit. ChrMeRIP and input samples are from SySy. y-axis shows normalized intensity. (E) Heat map showing (ChrMeRIP and Input of SySy and Abcam) signal intensity for each 5′ splice site as well as strand-specific flanking 1-kb region from splicing changed A5SS and ALE from B–D. Gray dashed lines indicate 5′ splice sites for each type. (F) Genome Browser tracks for Tor1aip2 gene. From top to bottom, they denote CAGE-seq, ChrMeRIP-seq (Abcam, two replicates; SySy, two replicates), RBM15 irCLIP-seq (two replicates), and H3K36me3 ChIP-seq. The dashed box depicts the most significantly changed splicing cluster in this study. (G) Sashimi plot of the Tor1aip2 splicing cluster. The dashed box is the same as F with deltaPSI calculated from LeafCutter. The annotated last exon containing m6A modification at the splicing site is shown below.


