
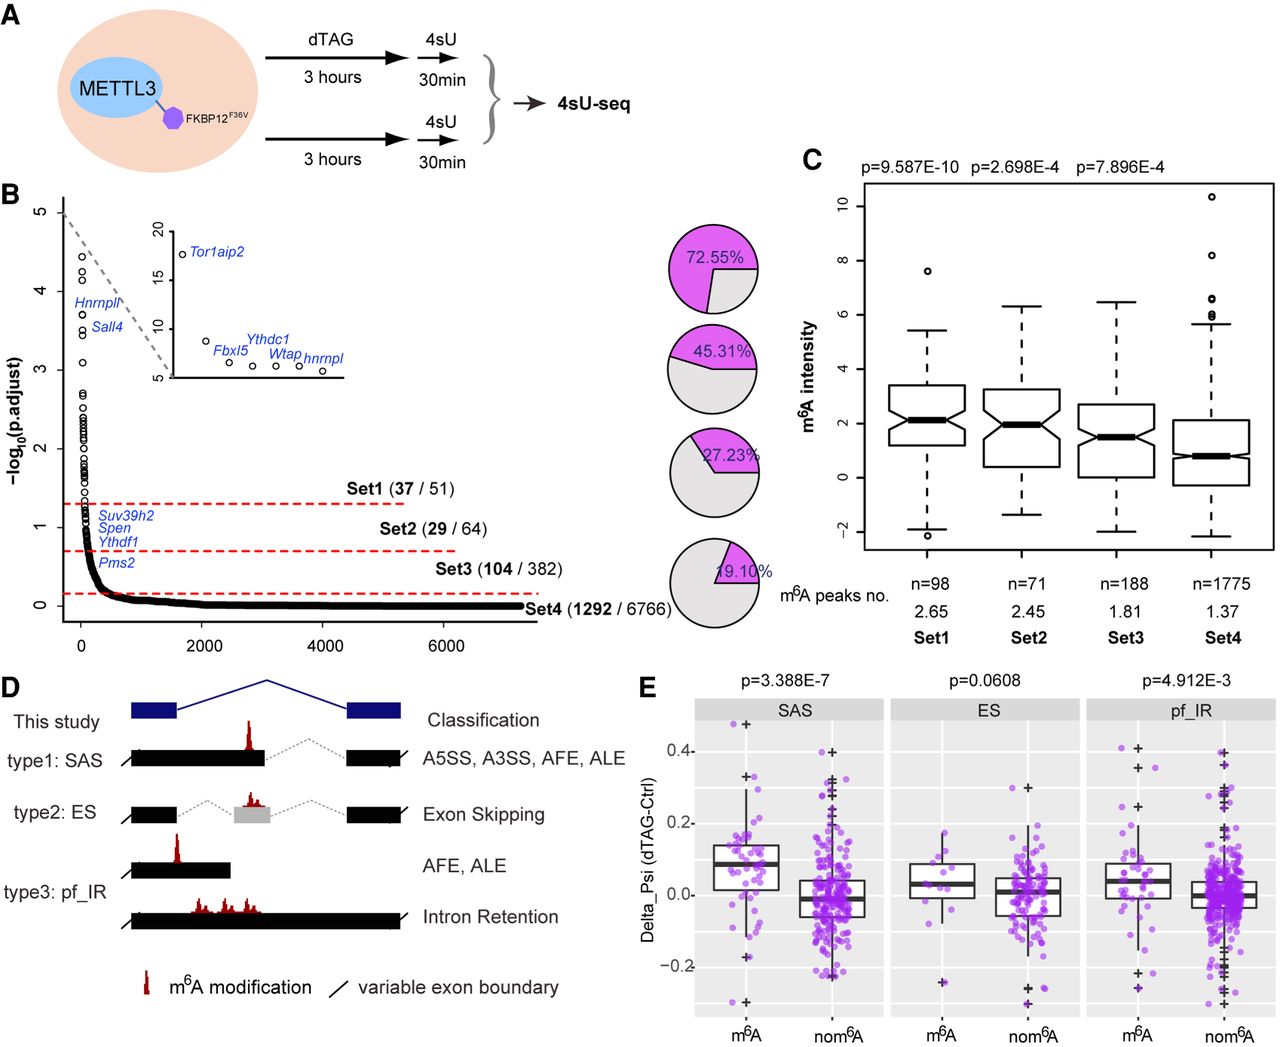
Rapid depletion of METTL3 causes m6A-targeted alternative splicing. (A) Schematic of 4sU-seq experimental design. (B) The output from intron-centric software LeafCutter ranks splicing clusters that change upon dTAG-13 treatment. Splicing clusters are ordered on the x-axis according to their significance, which is plotted on the y-axis (−log10[p.adjust]). Three different cutoffs were set to produce four groups graded by splicing significance. Selected genes are labeled. Pie charts (right) show the fraction of splicing cluster having or neighboring m6A modification. (C) Box plots showing the m6A intensity distribution calculated from ChrMeRIP-seq. m6A peaks from high to low significance groups are ordered from left to right. P-values above boxes were calculated by a two-sided t-test for each group with respect to the non-splicing-change group (far right). The total peak number and average peak intensity for each splicing cluster are shown below. (D) Schematic showing types of splicing classified, with nomenclature used in this study (left) and canonical splicing classification (right). (E) Box plots comparing the deltaPSI for each group (SAS, ES, and pf_IR). Splicing clusters with m6A modification located at the alternative intron/exon (left) are compared to splicing clusters from same group without m6A modification (right) as a batch-matched control. P-values shown above are calculated by a one-sided Wilcoxon test. Positive deltaPSI indicates increased inclusion upon depletion of METTL3.


