
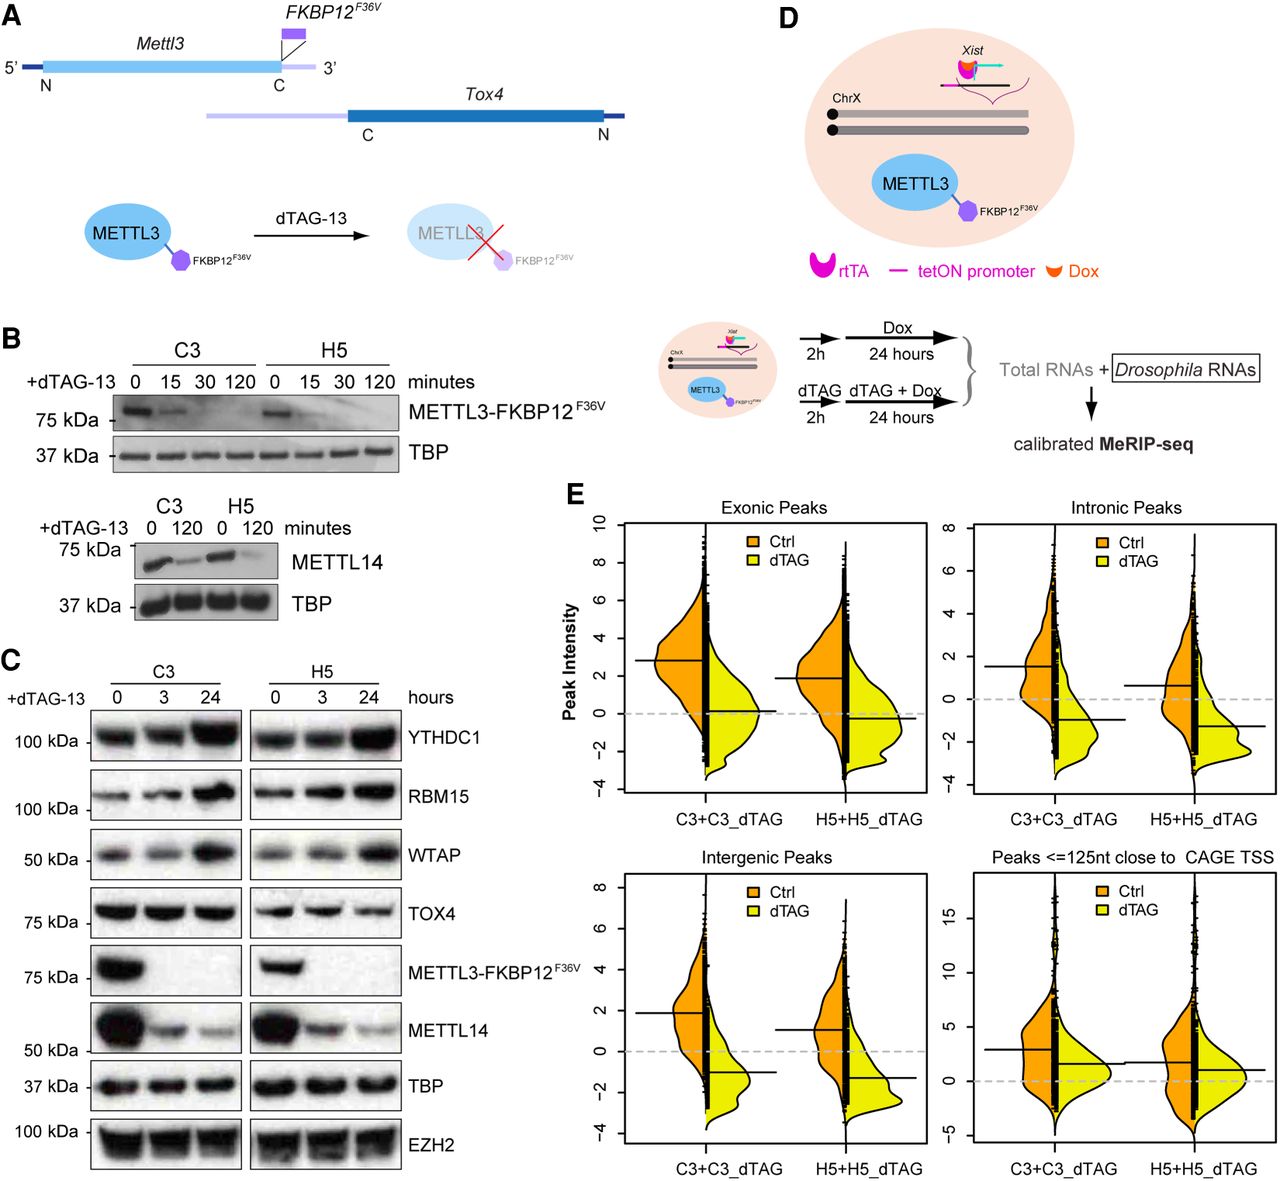
Acute depletion of METTL3 by dTAG system. (A) Schematic illustrates the FKBP12F36V insertion into the stop codon of the Mettl3 gene, which overlaps with Tox4 in an antisense manner. dTAG-13 molecules engage FKBP12F36V to trigger degradation of the fusion protein. (B) Western blots show degradation of METTL3_FKBP12F36V in a dTAG time-course treatment experiment (15, 30, 120 min) in two independent clones C3 and H5 (top). Lower panel shows METTL14 protein levels in C3 and H5 clones upon 120-min dTAG-13 treatment. TBP acts as a loading control. (C) Western blots show the protein levels for YTHDC1, RBM15, WTAP, TOX4, together with METTL3_FKBP12F36V and METTL14 in C3 and H5 clones upon 3- or 24-h dTAG-13 treatment. TBP and EZH2, encoded by another non-m6A-modified RNA, serve as loading controls. (D) Schematic showing FKBP12F36V inserted into the Mettl3 locus of hybrid XX mESCs expressing doxycycline-inducible Xist, and the calibrated MeRIP-seq workflow with Drosophila RNAs as a spike-in (bottom). Xist was induced after 2-h dTAG-13 treatment. (E) Bean plots of the calibrated m6A intensity distributions for peaks classified as exonic, intronic, intergenic from SySy antibody, as well as peaks within 125 nt of CAGE TSS. Left and right bean plots show clones C3 and H5, respectively. Orange and yellow back-to-back plots represent Ctrl and dTAG, respectively. The black solid lines denote the mean of each distribution, and gray dashed lines represent the threshold of nonenrichment.


