
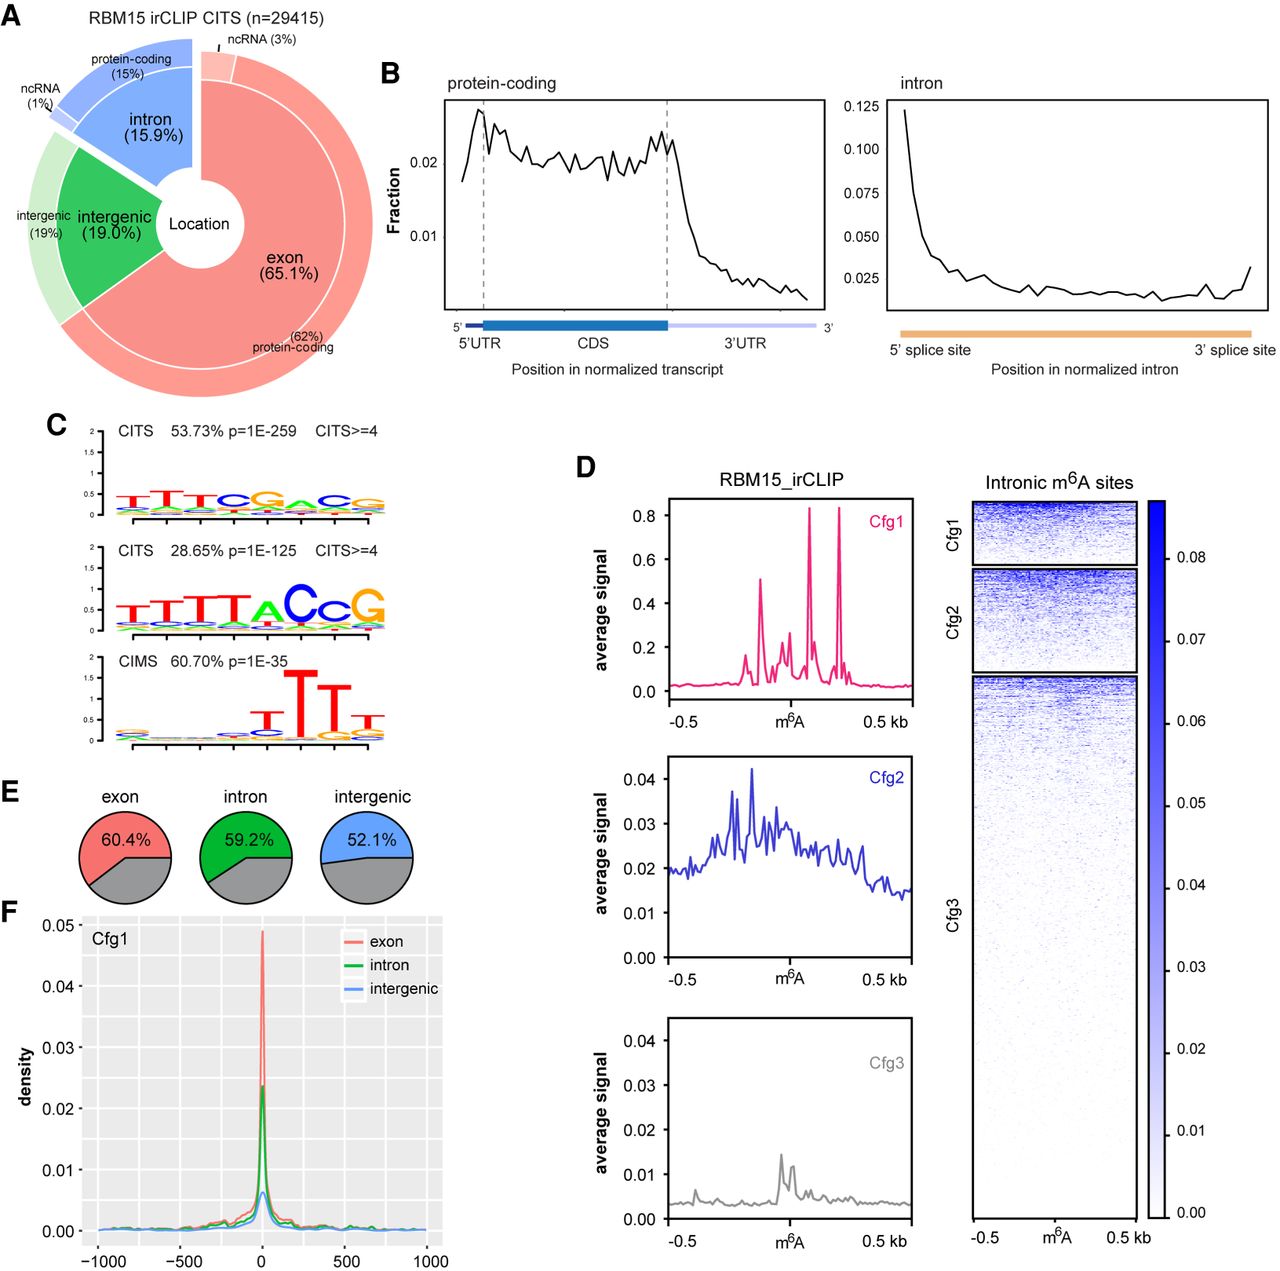
Intronic m6A methylation correlates with RBM15 binding and H3K36me3. (A) Pie chart shows the distribution of RBM15 binding sites, calculated from irCLIP cross-linking induced truncation sites (CITS ≥3). (B) The RNA-binding profiles of RBM15 in the transcriptome, calculated for aggregated gene models for protein-coding genes (left) and introns (right). (C) RNA-binding motifs occurring at RBM15 CITS and CIMS. (D) The RBM15 binding (CITS) metaprofile and heat map for intronic m6A peaks of three different confidence groups (red, blue, and gray for Cfg1, Cfg2, and Cfg3, respectively). The color key is shown on the right; 0.5-kb strand-specific flanking regions on each side of m6A peak summits are included for the plot. (E) Pie charts illustrating the fraction of Cfg1 m6A peaks with strong RBM15 CITS (≥3) within 1-kb flanking regions. Exonic, intronic, and intergenic m6A peaks are shown from left to right. (F) The RBM15 binding sites distribution (CITS≥3) centered on m6A peaks. Red, green, and blue lines represent exonic, intronic, and intergenic m6A peaks from Cfg1, respectively.


