
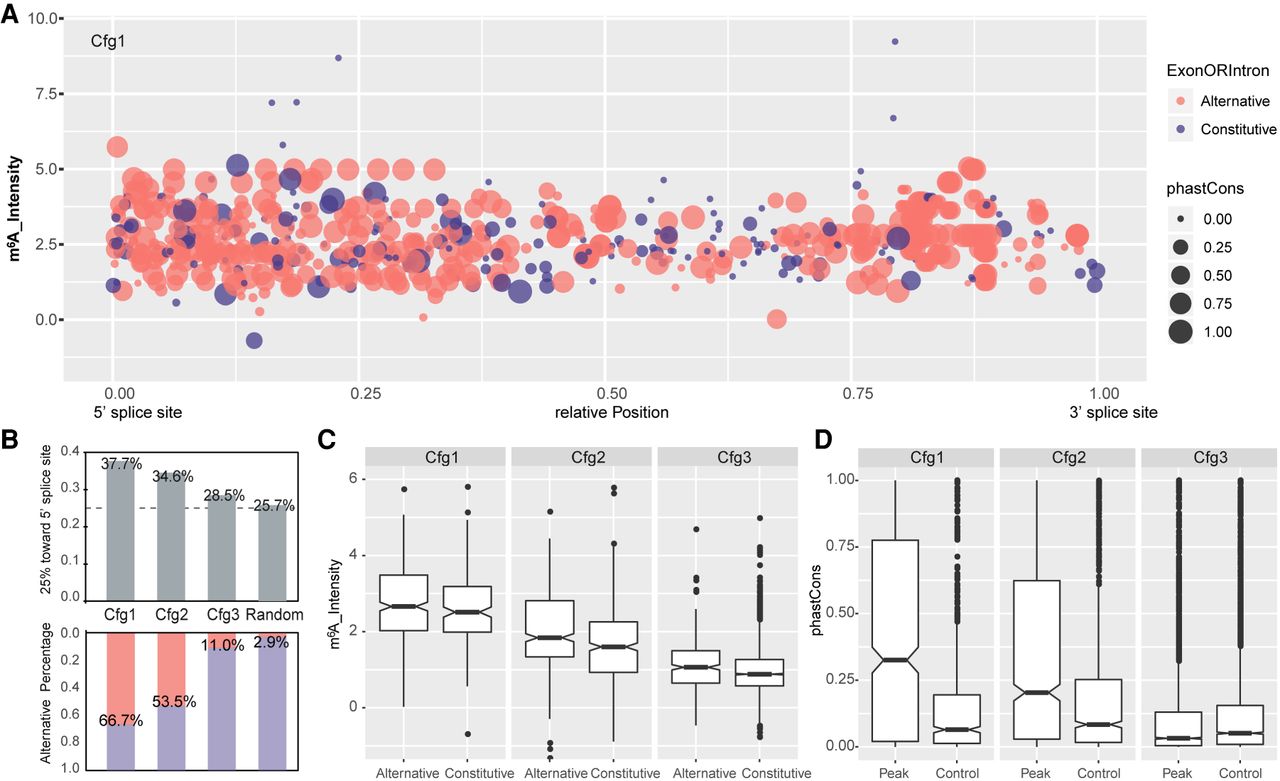
Patterns of intronic m6A modification. (A) Dot plots show the relative position, m6A intensity, conservation, and location in alternative or constitutive introns for all intronic m6A methylation in Cfg1. Here, 0 and 1 in the x-axis represent the 5′ and 3′ splice sites, respectively. The y-axis denotes m6A intensity calculated as an average of all replicates. Dot area indicates the phastCons conversation score. Red and blue denote location in alternative and constitutive introns, respectively. (B) Bar plots (top) showing the fraction of m6A peaks located in the first quarter (close to the 5′ splice site) of introns for Cfg1, Cfg2, and Cfg3 classes, as well as random simulated peak summits. Bar plots (bottom) showing the fraction of m6A peaks located in alternative exon/introns for all the groups. The percentages for each bar are labeled. (C) Box plots showing intensity of intronic m6A peaks located in alternative and constitutive introns for all classes. (D) Box plot of phastCons scores for all classes of m6A peaks located in intron regions annotated from the MaxORF_LongestNcRNA isoforms, compared with controls matched for size and intron-of-origin.


