
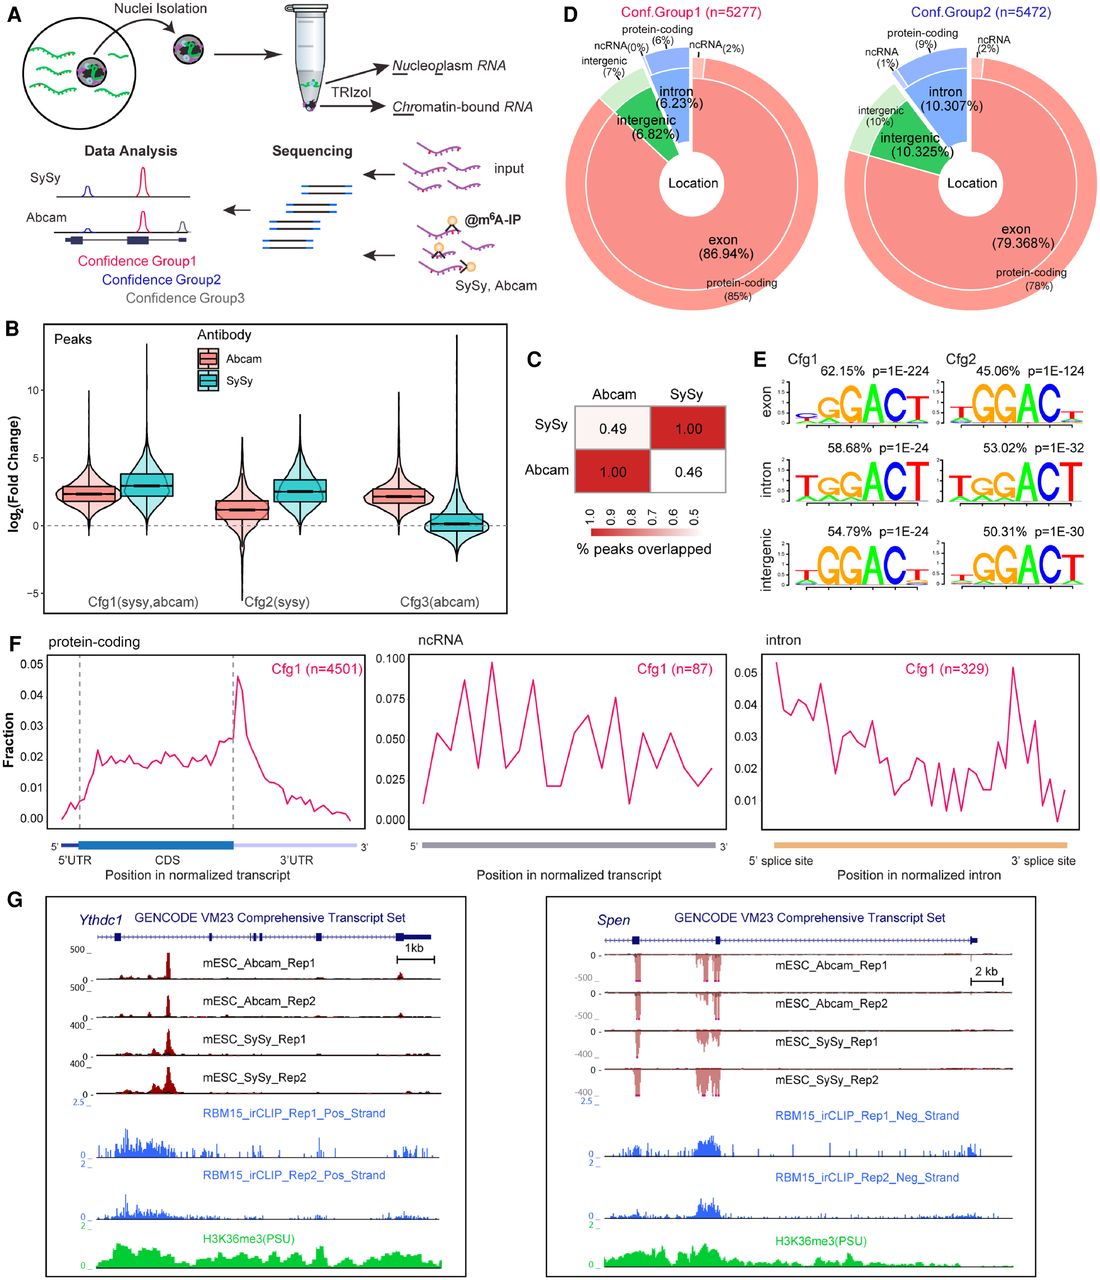
ChrMeRIP-seq reveals that 6%–10% of m6A peaks are located in introns. (A) Schematic illustrating the experimental and computational workflow for ChrMeRIP-seq. Chromatin-associated RNAs enriched for introns were used for MeRIP with two commercially available m6A antibodies (SySy and Abcam). Three confidence groups of m6A sites were identified. (B) Box plots showing the m6A intensity distributions for Confidence group (Cfg) 1, 2, and 3. Pink and cyan represent m6A intensity from Abcam and SySy antibodies, respectively. (C) Heat map showing the peak overlap between two antibodies. (D) Pie chart output from RNAmpp analysis showing the distribution of m6A peaks for Cfg1 (left) and Cfg2 (right) group. Peak numbers are indicated above. The MaxORF and longestNcRNA isoform was chosen for each gene. (E) Most representative motifs called for each subgroup (exonic, intronic, and intergenic) in Cfg1 and Cfg2 groups. Peak numbers are indicated. (F) RNAmpp analysis of m6A peaks distributions in transcriptome for Cfg1 group. Left plot is for aggregated protein-coding gene, middle for noncoding RNA, and right for normalized intron. (G) UCSC Genome Browser screenshots showing example genes (left, Ythdc1 intron11; right, Spen intron2) harboring intronic m6A methylation. From top to bottom, tracks denote gene annotation, ChrMeRIP-seq (Abcam 2 replicates, SySy 2 replicates), RBM15 irCLIP-seq (two replicates), and H3K36me3 ChIP-seq. The red and black in ChrMeRIP-seq indicate the IP and input, respectively.


