
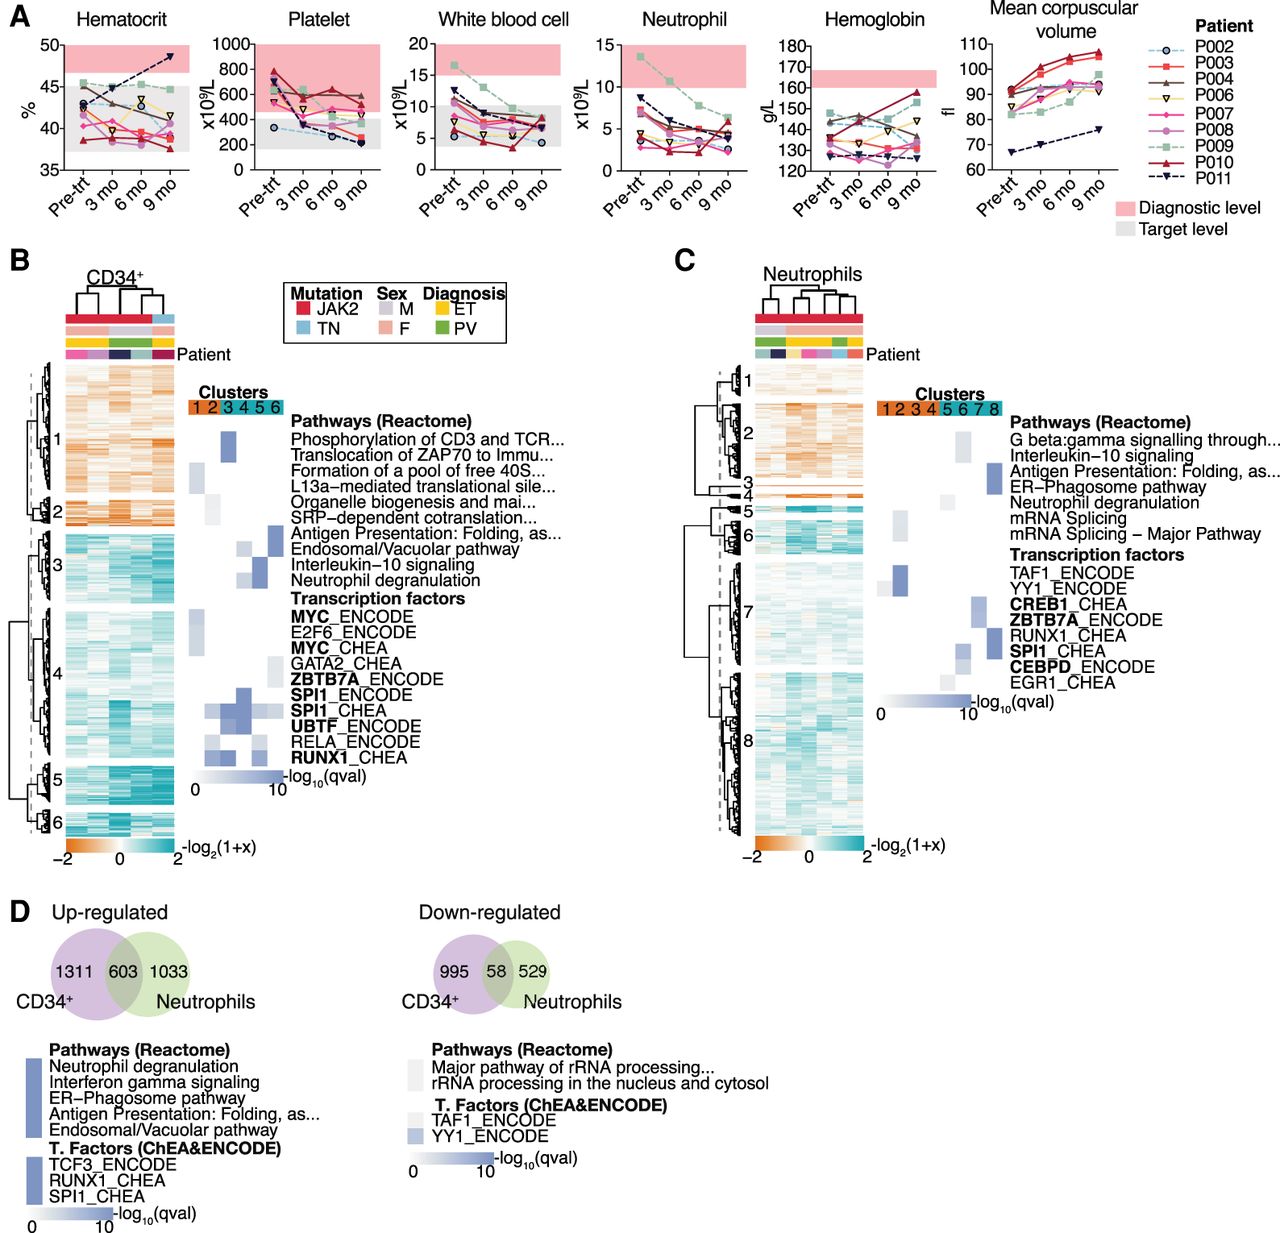
Blood cell counts through the course of the study and gene expression results of MPN patients. (A) Blood cell counts of clinical parameters monitored at four time points from each patient. The diagnostic criteria levels (Arber et al. 2016) and target level of the pharmacological treatment (Harrison et al. 2010; McMullin et al. 2019) are indicated. Hierarchical clustering of DEGs and the top significantly enriched terms for each cluster from CD34+ (B) and neutrophil cells (C). DEGs were clustered according to their log2-fold change expression over pretreatment samples (Euclidean correlation distance and ward.D2 agglomeration method). Clusters were divided at the same branch heights and numbered. Enrichment analyses for pathways and transcription factors were performed in each cluster. The top significantly enriched results from each cluster are represented as a heatmap plot in which color scale indicates significance. TF name in bold indicates that the gene is differentially expressed. (D) Venn diagram of common DEGs among CD34+ cells and neutrophils and results of enrichment analysis performed in the shared genes. Enrichment analysis was performed separately for up-regulated and down-regulated genes.


