
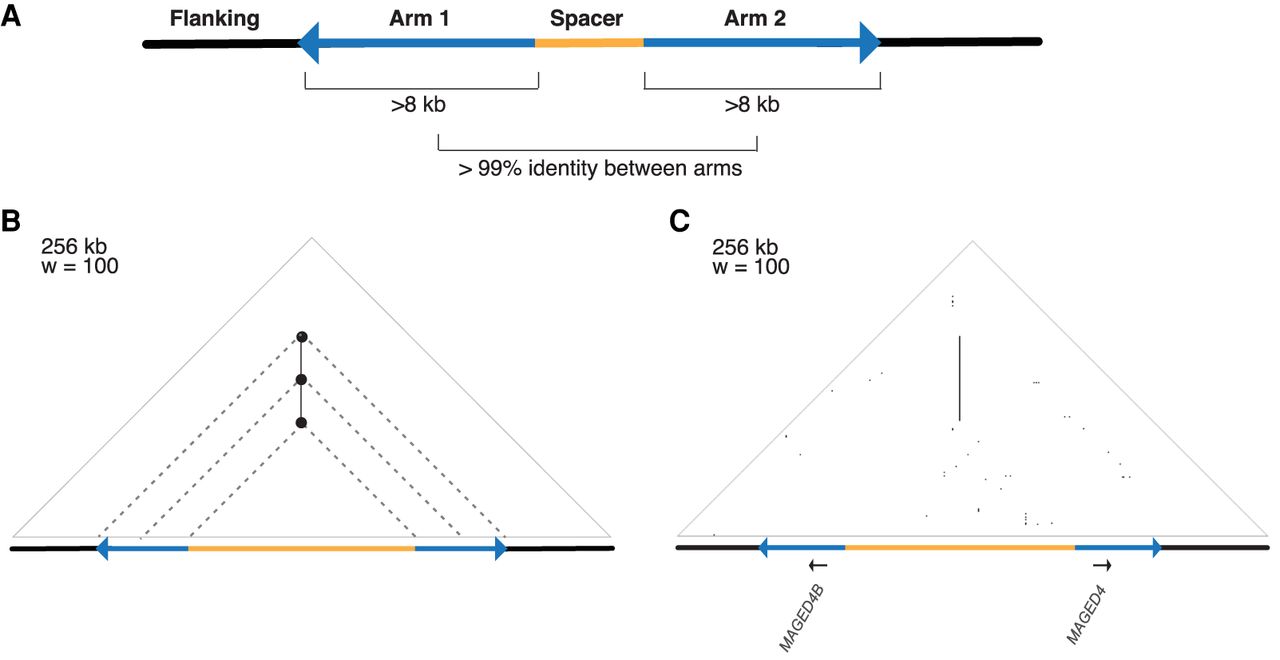
Figure 1.
Overview of human X-Chromosome palindromes. (A) Schematic of a palindrome. (B) Schematic of a triangular dot plot. Dots are placed at a 90° angle between identical k-mers, or “words,” within a DNA sequence. Palindromes appear as vertical lines. (w) Word size used to construct the dot plot. (C) Triangular dot plot for human X palindrome P3, including annotated protein-coding genes.


